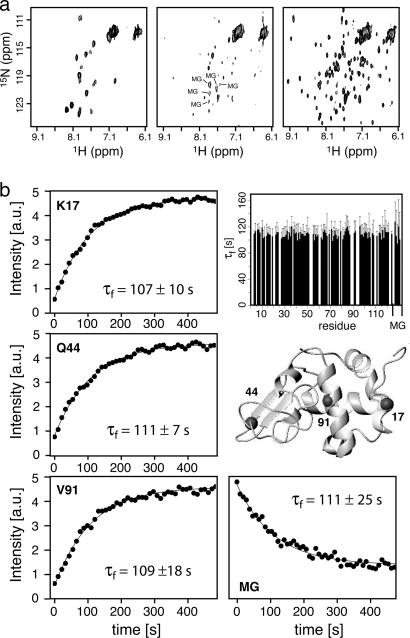
Fig. 2.
Folding of α-lactalbumin studied by SOFAST real-time 2D NMR. (a) FTA-SOFAST-HMQC spectra of bovine α-lactalbumin at pH 2.0 (Left), immediately after a sudden pH jump to pH 8.0 that triggers folding (Center), and 120 s after injection (Right). Each spectrum shows the sum of two acquisitions of 10.9-s duration. Peaks corresponding to the MG state that disappear during folding are annotated. (b) Refolding kinetics of bovine α-lactalbumin from the MG state to the native state. The measured peak intensities are plotted as a function of the folding time. Shown are three residues situated in loop (K17), β-sheet (Q44), and α-helical regions (V91) that are indicated on the structure (Protein Data Bank ID code 1F6R). In addition, the signal decay observed for a peak assigned to the MG state is shown. Solid lines represent best fits to a three-parameter exponential function. A histogram shows the measured folding time constants for 92 residues in the native state as well as the 5 rates measured for the disappearance of the MG state.

