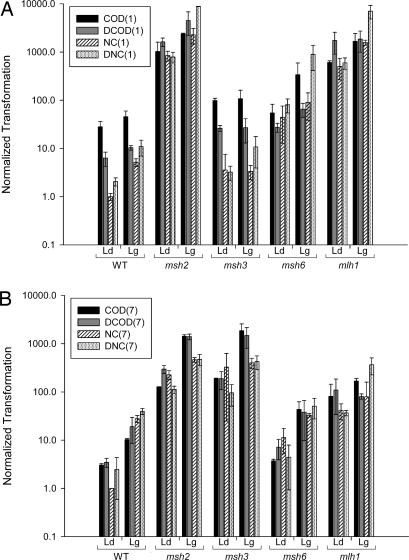
Fig. 2.
ssOT is affected by MMR. The ratio of ssOT to control plasmid transformation was normalized to a value of 1.0 for transformation of the NC (1) or NC (7) ssOligo when annealing to the leading strand of replication (A and B, respectively). Error bars represent standard deviations from two or more experiments. For each genetic background, transformation to the leading strand (Ld) versus lagging strand (Lg) is indicated.

