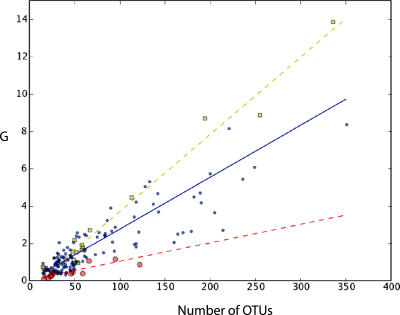
Fig. 3.
Unique diversity (G) regression analysis. Plot of the amount of branch length that is added to the phylogenetic tree (G value) by each of the 202 samples, vs. the number of OTUs that represents each sample. The main regression line is shown in blue. Bacteria that were cultured from nonsaline environments (pink circles) generally fell below the main regression line (i.e., they had negative residuals for G), thus contributing less unique diversity. Samples in the saline–misc group (yellow squares) generally fell above the main regression line (i.e., they had positive residuals for G), thus contributing more unique diversity.

