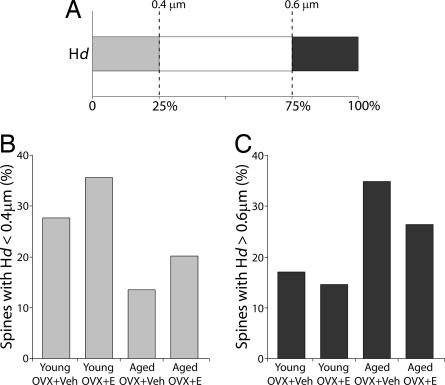
Fig. 5.
Quartile analysis of Hd. (A) Randomly sampled spines (850; 170 in each of five animals) were selected from each of the four groups to determine the relative contribution of each group to the smallest 25th percentile (<0.4 μm) and the largest 25th percentile (>0.6 μm). Proportions of spines below and above the two quartiles were generated for each group. (B) The smaller (Hd < 0.4 μm) spine counts in the young animals were almost double those of the aged animals (P < 0.001). (C) The larger (Hd > 0.6 μm) spine counts were higher in the aged animals (P < 0.001). Overall, E treatment induces greater numbers of smaller spines in both young and aged groups (P < 0.001).

