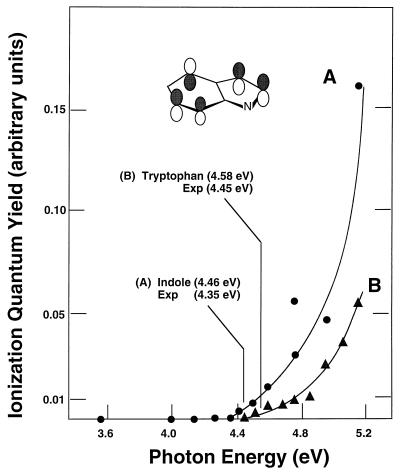
Figure 3.
Comparison of aqueous ionization energies of indole and tryptophan obtained by using the present methods with experimental threshold energies for conduction-band ionization. The orbital diagram describes the highest occupied molecular orbital in indole and tryptophan. Experimental threshold energies and data were taken from ref. 25.

