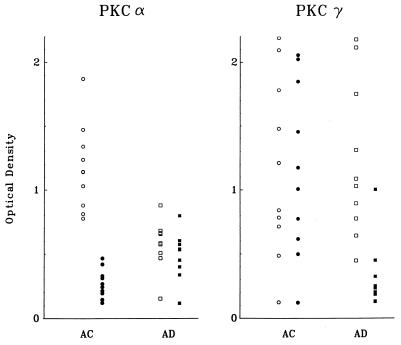
Figure 2.
Scatter plots of optical values from PKCα (A) and PKCγ (B) immunoreactivities in each cell line (10 aged-matched controls, 4 nonfamilial AD, and 6 familial AD). The graph clearly illustrates the significant differences, with no overlap, between the untreated (○) and treated (•) control (AC) and the untreated (□) and treated (▪) AD cell lines.

