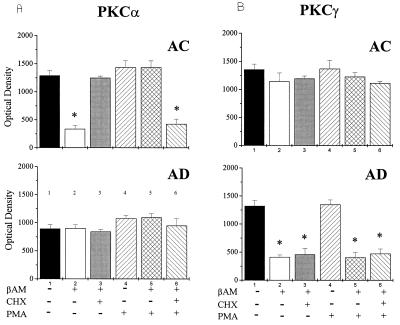
Figure 7.
Bar graphs of densitometric values representing the immunoreactivity following phorbol ester (PMA) and cycloheximide (CHX) treatment in AC (A) and AD (B) fibroblasts (optical density is an arbitrary unit from densitometric analyses of the immunoreactive bands; values are the mean ± SEM of three experiments per group; ∗, P < 0.001, two-tailed t test).

