
Fig. 3.
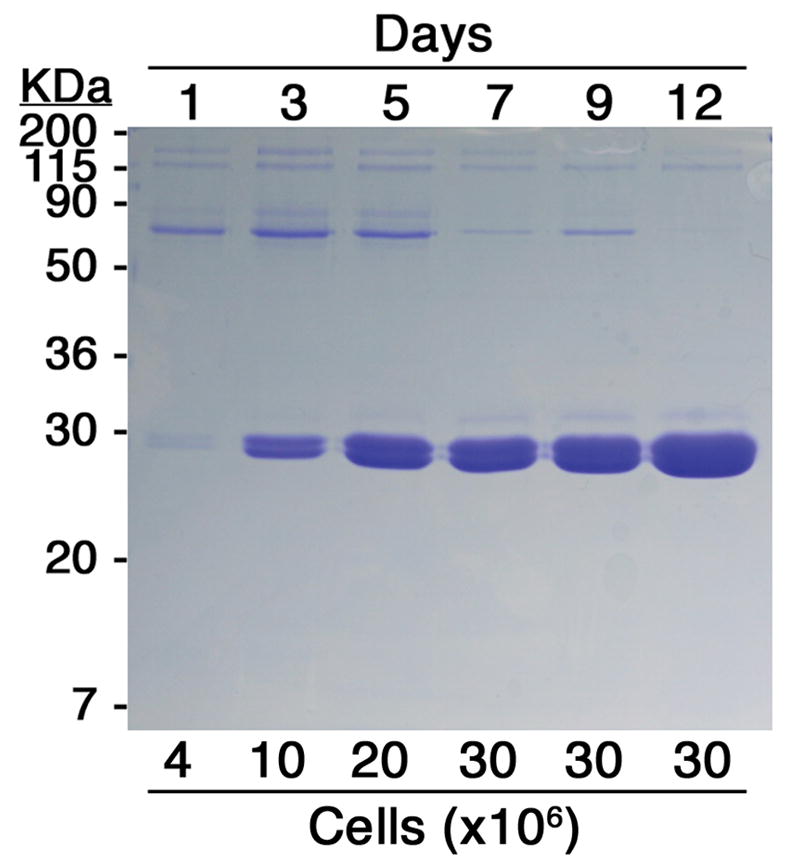
Time course of Fab expression. 18×106 cells expressing Fab 2A11 were equally divided into 6, 10cm-diameter dishes, in 10mL of medium. At each time point, the medium from a plate was removed, cells counted, and the Fab purified. 1/10th of each purified sample was run on an SDS-PAGE gel, stained with Coomassie blue. The length of each incubation period is indicated above the matching lane, in days, and the corresponding number of cells, in millions, below. The yield of Fab resulting from a 12day incubation period was quantified by absorbance reading at 280nM.