
Fig. 4.
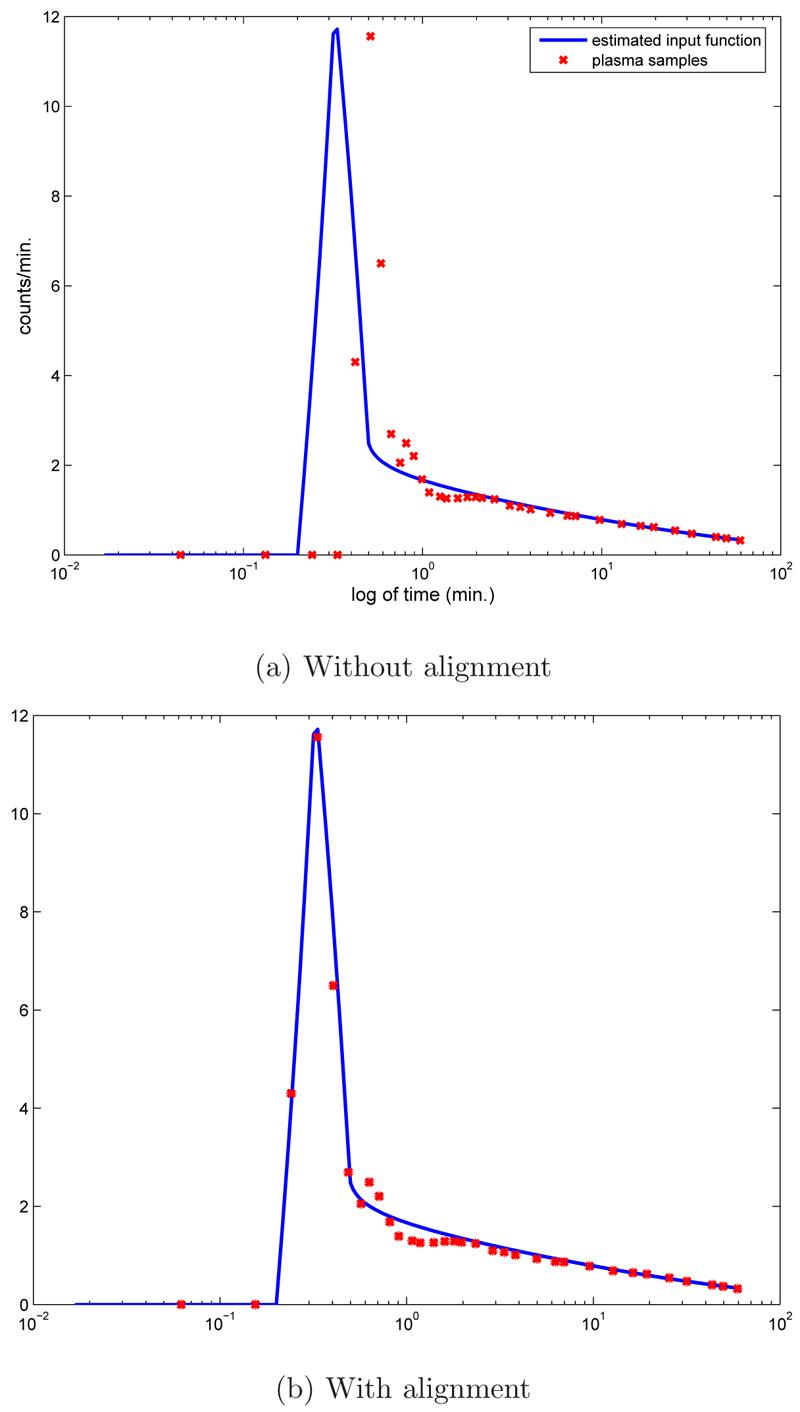
The recovered input function ue(t) compared with arterial plasma samples, up(t). Illustrated are the data given on logarithm time scale (a), and (b) the same data with ue(t) shifted to account for the time delay relative to up(t).
Official websites use .gov
A
.gov website belongs to an official
government organization in the United States.
Secure .gov websites use HTTPS
A lock (
) or https:// means you've safely
connected to the .gov website. Share sensitive
information only on official, secure websites.
The recovered input function ue(t) compared with arterial plasma samples, up(t). Illustrated are the data given on logarithm time scale (a), and (b) the same data with ue(t) shifted to account for the time delay relative to up(t).