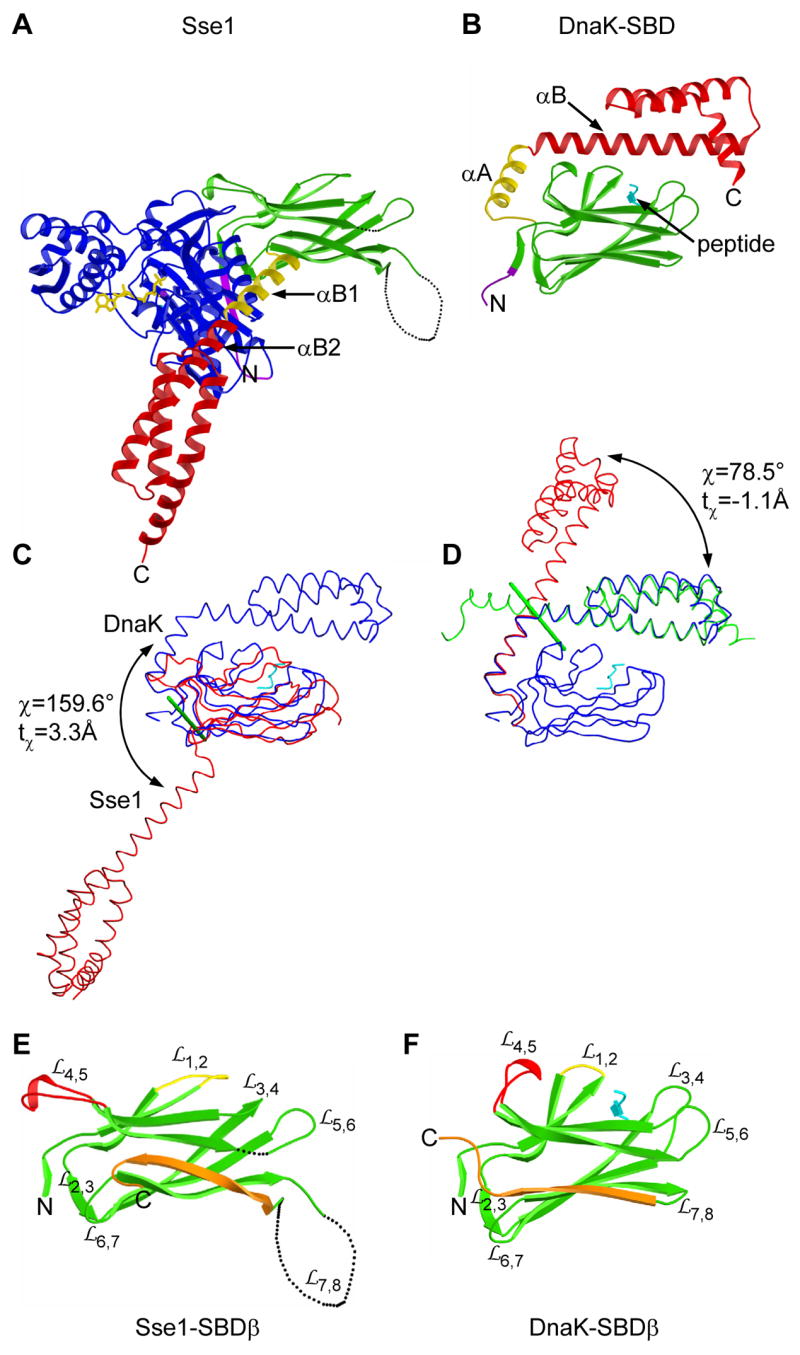
Figure 2. Comparison of SBD conformations in Sse1 and DnaK.

(A) Ribbon diagram of Sse1 drawn and colored as in 1B except that helix αB1 is now yellow. Orientation is after superposition of its SBDβ onto that of DnaK as in 2B. (B) Ribbon diagram of the DnaK SBD complexed with a heptapeptide (cyan). Linker and SBD coloring is as in A. (C) Superposition of SBD from Sse1 (red) with that of DnaK (blue) complexed with a heptapeptide (cyan) as based on SBDβ Cαs. Cα traces are oriented as in A and B. Rotation of α-subdomains is about the green rod. (D) Superposition of the DnaK SBD (blue) with SBDα from Sse1 as based on helix αA/αB1 (red) or helices αB/αC/αD/αE (green). Rotation is about the green rod. (E) Ribbon diagram of Sse1 SBDβ oriented as in A. Conformationally distinct features are highlighted: (yellow), (red), and β8 through β-α connector (orange). (F) Ribbon diagram of DnaK SBDβ oriented and colored as in E, adding the heptapeptide (cyan).
