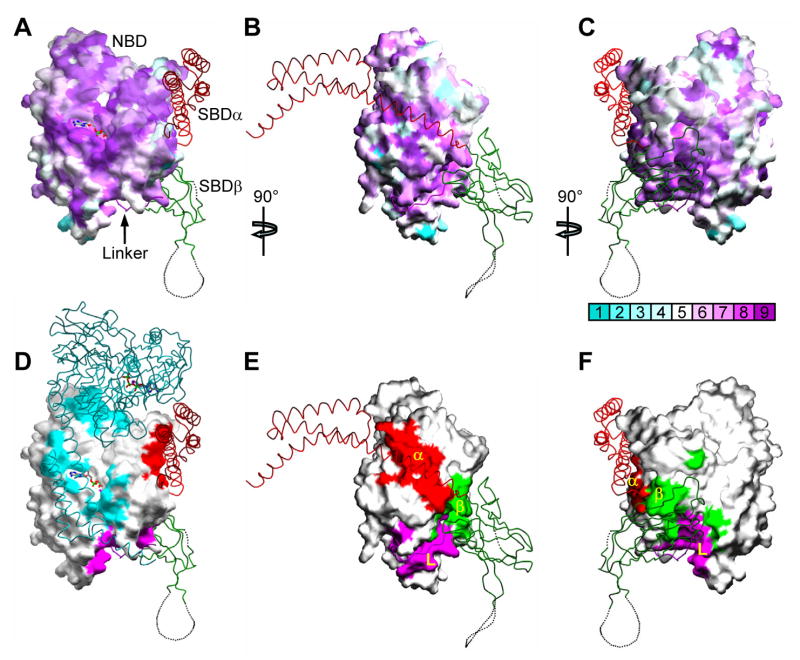
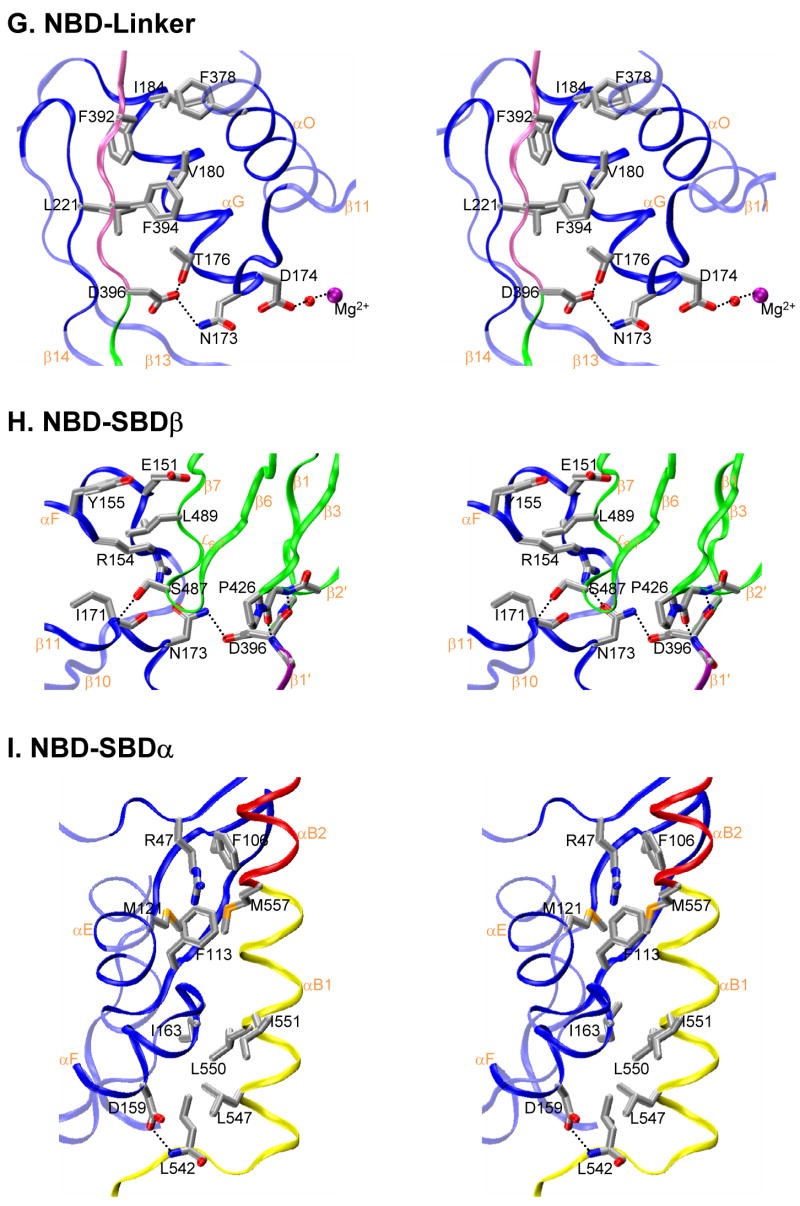
Figure 4. Characteristics of interdomain interfaces.
(A, B, C) Mapping of NBD sequence conservation onto the NBD surface from Sse1. Three orthogonal views are presented: (A) front view as in 1B, (B) side view as in 1C, and (C) back view, rotated 180° from A about the vertical axis. Sequence similarity is quantified from across the Hsp70 superfamily and mapped by ConSurf (http://consurf.tau.ac.il/) into colors of increasing purple intensity for conservation and increasing aqua intensity for variability (key under C), relative to average conservation (white). Cα traces are overlayed from SBD components color coded as linker (purple), SBDβ (green) and SBDα (red). (D, E, F) Mapping of NBD surfaces as buried into linker and SBD interfaces. Views are as in A, B and C, respectively. Surface imprints are shown colored: SBDα (red), SBDβ (green), interdomain linker (purple), and apposing protomer (cyan). Cα traces are overlayed as in A, B and C, adding the apposing protomer in cyan for D. (G, H, I) Stereodrawings of interdomain interfaces featuring residues targeted for mutagenesis. Main-chain ribbons are colored as in 1 and side-chain atoms are colored as in 3C. (G) NBD-linker interface. (H) NBD-SBDβ interface. (I) NBD-SBDα interface.


