
Figure 3. Electron density for the TelK-DNA complex.
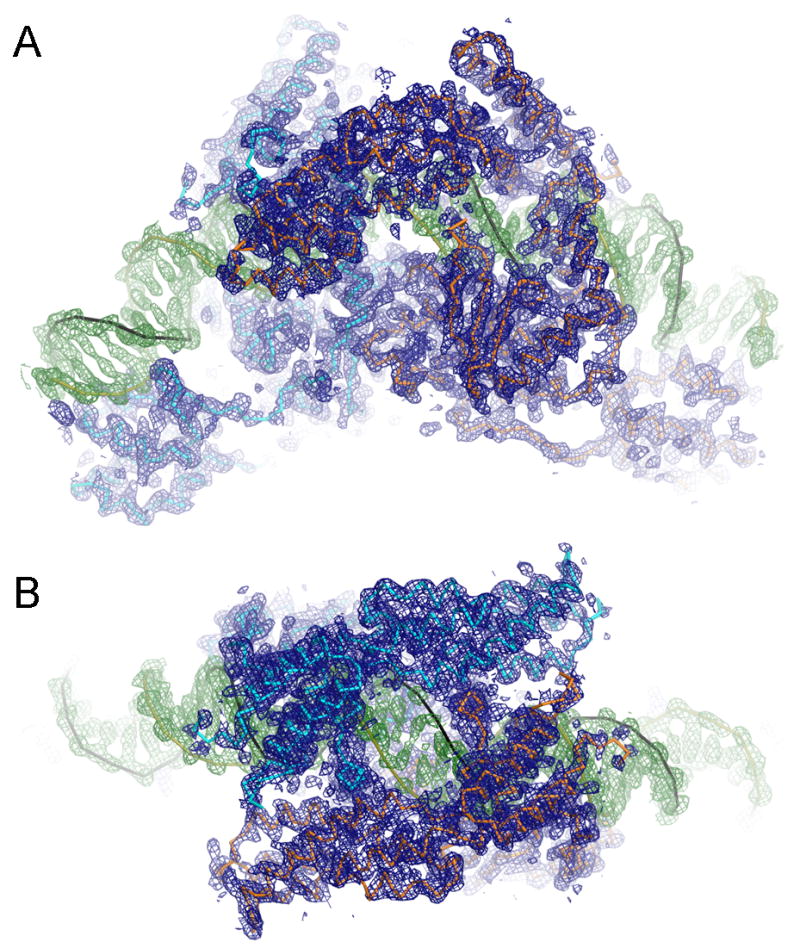
The simulated annealing composite omit map at 3.2 Å resolution for the TelK-DNA-vanadate complex that represents the intermediate of DNA cleavage reaction. The electron density within 2.5Å from atoms in the final model is shown at a contour level of 1σ above the mean. Densities for protein and DNA are colored in blue and green, respectively. (A) A view perpendicular to the 2-fold noncrystallographic symmetry axis that relates two TelK subunits. (B) Top view along the 2-fold axis.