
Figure 3. Correlation between protein abundance estimate from cLC-FTICR-MS and protein concentrations measured by standard clinical chemistry methods.
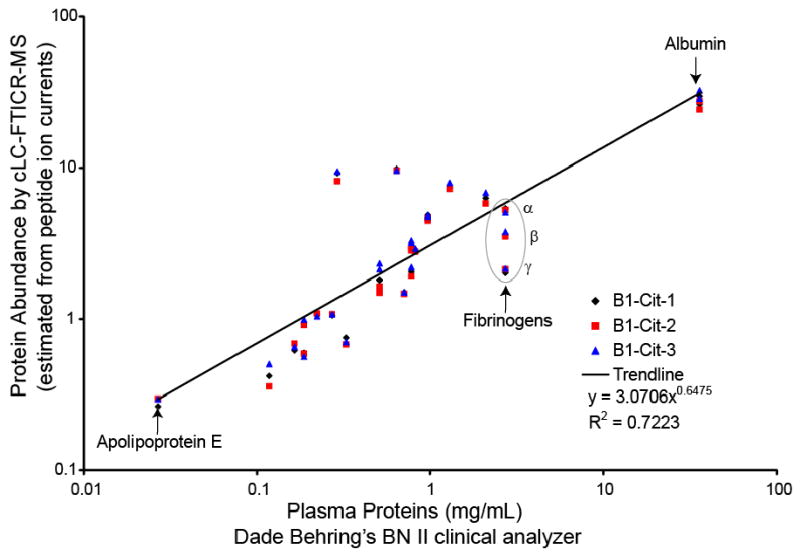
Average peptide ion currents from cLC-FTICR MS and measurements performed on BN II clinical analyzer (Dade Behring) were compared for 18 proteins in the B1-CIT sample. The triplicate ion current value for each analysis was plotted with multiple protein entries where appropriate (e.g., fibrinogen was mapped to multiple IPI numbers representing fibrinogen α, β, and γ). Selected proteins are also shown on the graph for perspective. The proteins on the graph in order of increasing abundance are: apoplipoprotein E, plasminogen, complement C4, ceruloplasmin, transthyretin, antithrombin-III, apolipoprotein A-II, fibronectin, alpha-1-acid glycoprotein 1, hemopexin, complement component 3, haptoglobin, alpha-2-macroglobulin, alpha-1-antitrypsin, apolipoprotein A-I, transferrin, fibrinogen, albumin.