
Figure 5. Identification of proteins differentially abundant in citrated-plasma and serum.
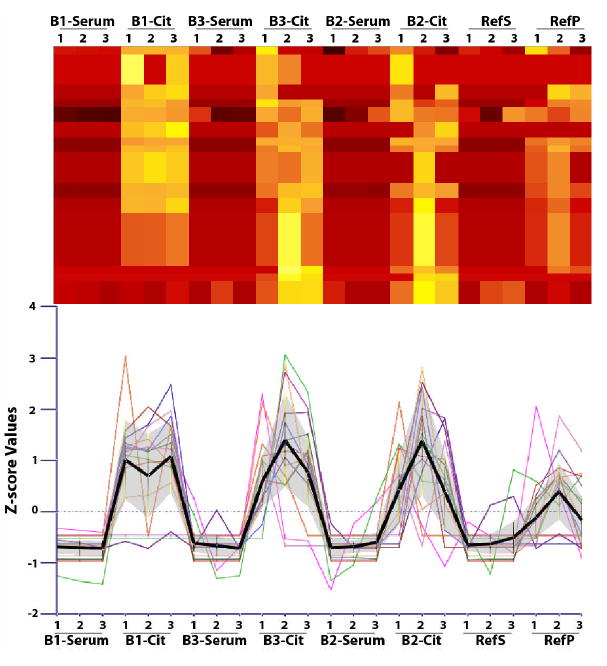
This illustration shows a heat map of a serum/plasma specific cluster from results in Figure 4 and a profile plot. The black profile shows the average value of this cluster and the grey region above and below that profile represents one standard deviation from the measurements.