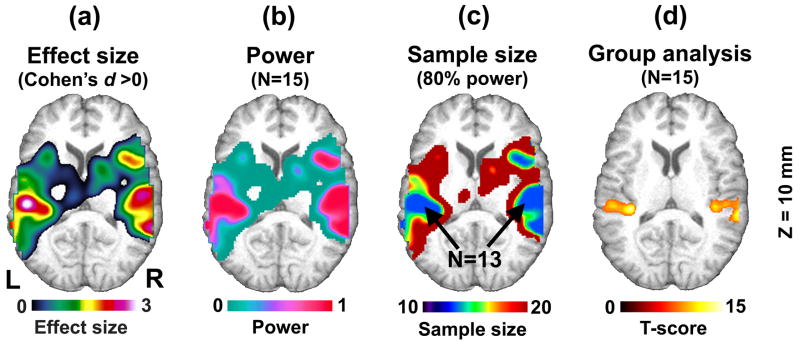
Figure 9.
From the mock pilot analysis results, an effect size map was generated (Cohen’s d >0) (a). Based on this effect size, a power map was generated for N=15 subjects (b). The corresponding sample size map was also generated to determine the number of subjects required to detect signals with 80% power (c). Activations in the bilateral auditory cortices were found in the follow-up analysis with 15 randomly selected subjects from the fMRI data pool (d). The maps (b)-(d) are corrected for multiple comparisons (p<0.05, FWE corrected at voxel-level).

