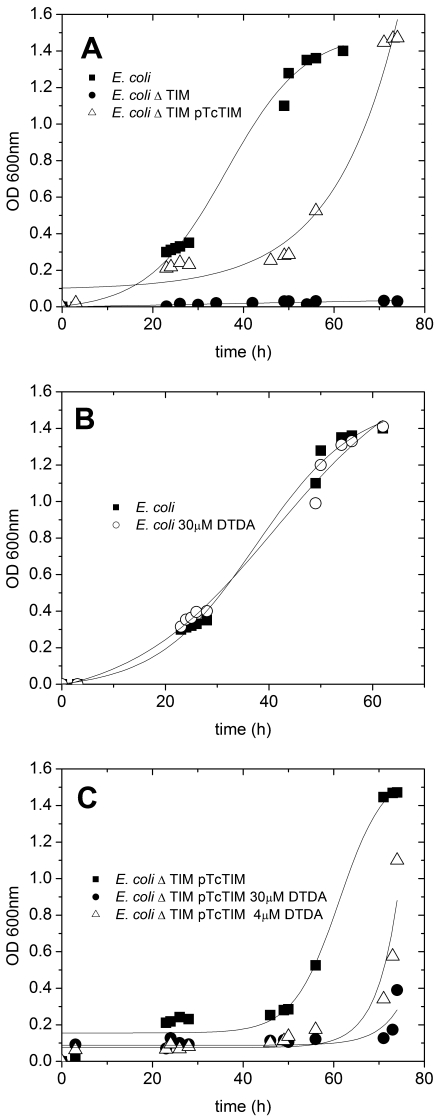
Figure 5. Growth of intact E. coli, of cells that lacked their endogeous TIM, and of E. coli cells in which their endogenous was replaced with TcTIM.
Effect of DTDA. A shows the growth of intact E. coli (closed squares), E. coli whose TIM had been deleted (closed circles), and E. coli transformed with TcTIM (open triangles). Panel B depicts the growth curves of intact E. coli with and without 30 µM DTDA (closed squares and open circles, respectively). Panel C shows the growth curves of E. coli cells that had TcTIM instead of their own TIM with the indicated concentrations of DTDA.

