
Figure 2. Effect sizes for 19 individual test scores based on demographically-adjusted T-scores produced by patients with schizophrenia (SZ) and bipolar I disorder (BD) compared to healthy adults.
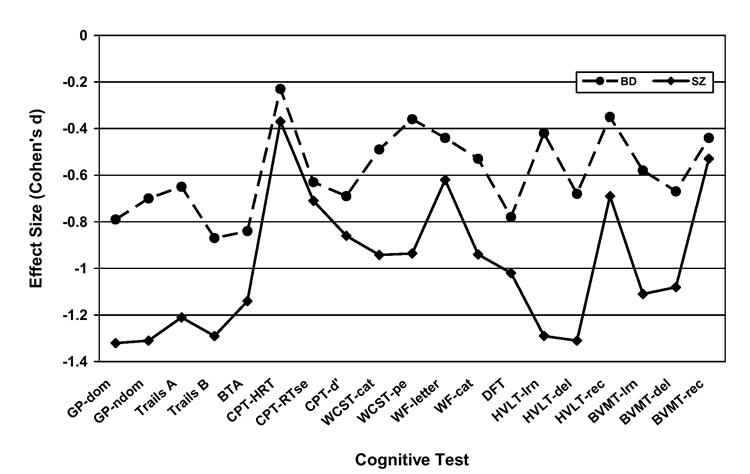
MANOVA planned contrasts confirmed that each patient group performed significantly (p < 0.01) worse than healthy adults on every measure except CPT Hit RT, on which the BD group did not differ significantly from healthy controls. Bonferroni-corrected post hoc comparisons showed the SZ and BD patient groups differed significantly (p < 0.05) on 11 of 19 measures. Note: GP-dom and GP-ndom = Grooved Pegboard dominant and non-dominant hands; Trails = Trail Making Test; BTA = Brief Test of Attention; CPT-HRT, CPT-RTse, and CPT-d’ = Continuous Performance Test hit reaction time, hit RT standard error, and discrimination; WCST-cat and WCST-pe = Wisconsin Card Sorting Test categories and perseverative errors; WF-letter and WF-cat = Word Fluency letters (S & P) and categories (animals & supermarket items); DFT = Design Fluency Test; HVLT-lrn, HVLT-del, HVLT-rec and BVMT-lrn, BVMT-del, BVMT-rec = Hopkins Verbal Learning Test and Brief Visuospatial Memory test learning, delayed recall, and recognition discrimination, respectively.