
Figure 2. Blood pressure and respiratory rate in OP poisoned animals with and without mechanical ventilation.
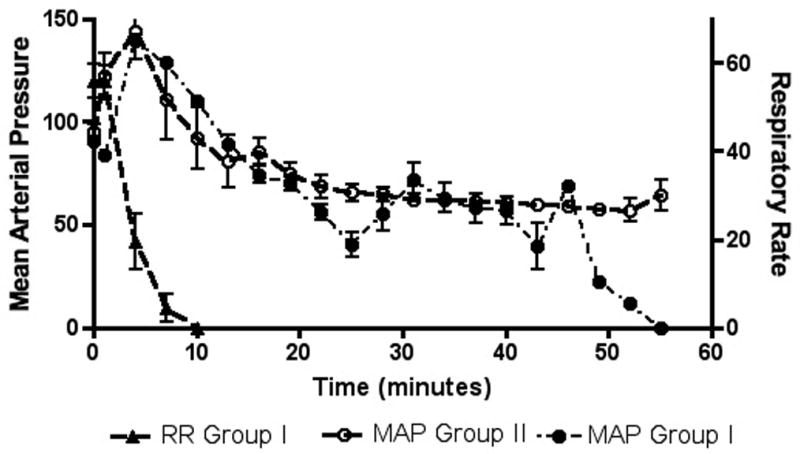
Grouped data sets show respiratory rate and mean arterial pressure for animals with acute OP and no further intervention (Group I) and mean arterial pressure for animals with acute OP and mechanical ventilation initiated at the point of apnea (Group II). Results are shown as mean value +/− standard error with respiratory rate represented on the right axis and mean arterial pressure on the left axis. The respiratory rate of Group II is not shown, as it was almost identical to the respiratory rate curve of Group I. In all groups poisoning occurred at 1 minute (black arrow).