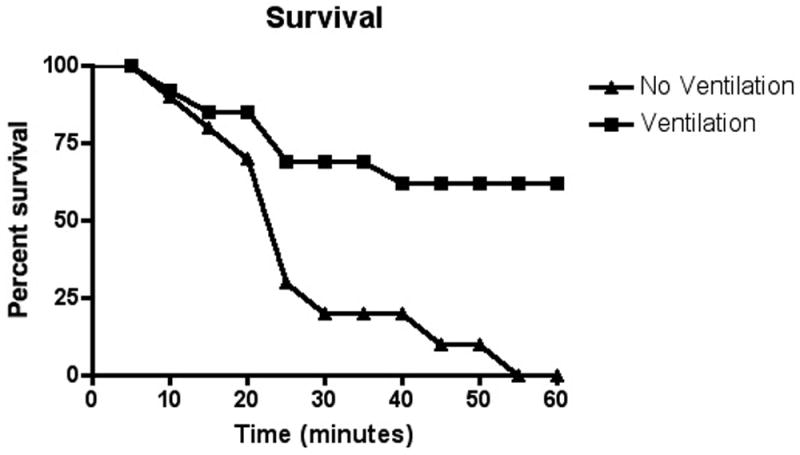
Figure 3. Survival histogram ventilated and non-ventilated animals.

Grouped data sets for animals with OP exposure but no intervention (Group I) and all animals with OP exposure but mechanical ventilation (Group II and III) are displayed as mortality rate over time. Data is binned into 5-minute time blocks and presented as the percent of animals that survived to the end of the time block. Group IV (unanaesthetized) data not available secondary to lack of invasive cardiovascular monitoring.
