
Figure 5. Alveolar-arterial gradient in animals receiving mechanical ventilation.
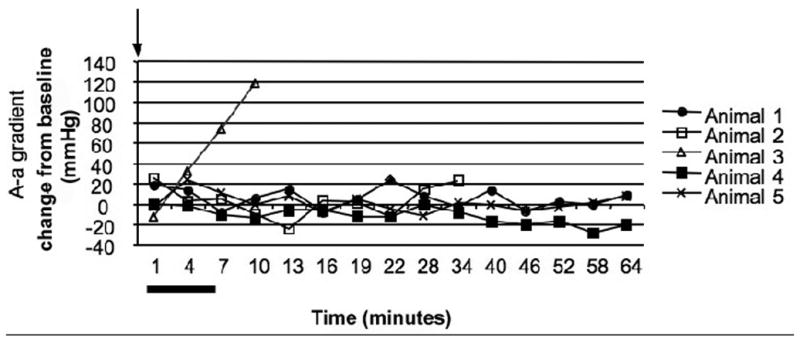
A - A graphical depiction of alveolar-arterial gradient for each animal that was exposed to OP and received mechanical ventilation throughout the experiment (Group III) is plotted over time. One of the animals in this group is not included due to inability to obtain the necessary data points. Arterial blood gas measurements were obtained on a pre-determined schedule with a measurement every 3 minutes initially (8 times) and then every 6 minutes (7 times). The alveolar-arterial gradient is presented as change from baseline levels. All animals were poisoned at zero minutes (black arrow). Although the animals in this figure were paralyzed, the range of point of apnea in other groups is represented by a black bar under the X axis. Data points for animals that survived to the study endpoint are solid shapes with data points for animals that died indicated by open shapes.
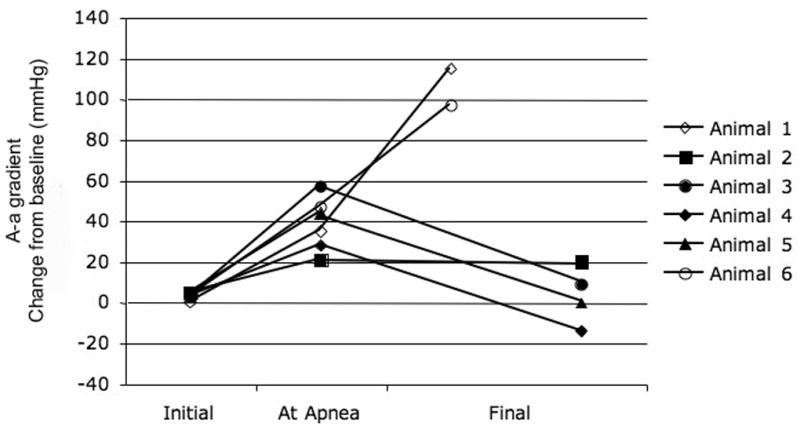
B - A graphical depiction of alveolar-arterial gradient for each animal that was exposed to OP and received mechanical ventilation at the point of apnea (Group II) is plotted for control period, at the point of apnea, and study endpoint. Six of the animals that received rescue mechanical ventilation had arterial blood gas measurements at these time points. The final endpoint was obtained just prior to cardiovascular collapse. A-a gradients are presented as change from baseline. Data points for animals that survived are represented as solid shapes and data points for animals that died are open shapes.