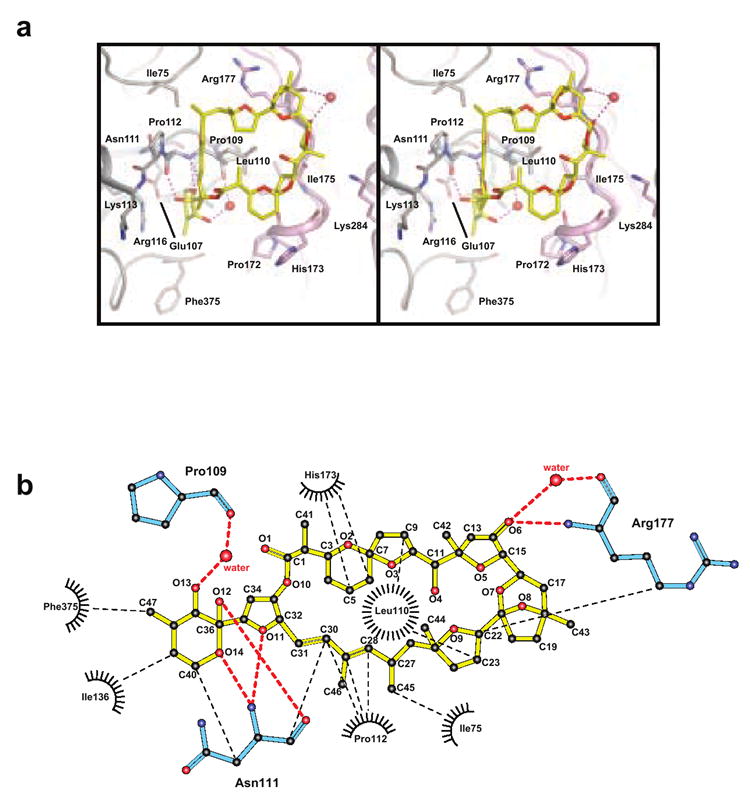
Figure 3. PTX-2–actin contacts.

(a) Stereo view of specific PTX-2–actin interactions are shown. PTX-2 is in yellow and its contact residues on actin are labeled and colored according to the domains to which they belong. Polar interactions between PTX-2 and actin are shown in purple. Waters involved in hydrogen bonding between PTX-2 and actin are shown as red spheres. (b) Ligplot of the interactions between PTX-2 and actin. Van der Waals contacts are represented by black spokes radiating between interacting residues and are connected by thin dashed black lines. Water molecules are depicted as red spheres with hydrogen bonding interactions connected by thick dashed red lines. Actin residues involved in polar interactions are colored cyan. Figure produced with the program LIGPLOT.59
