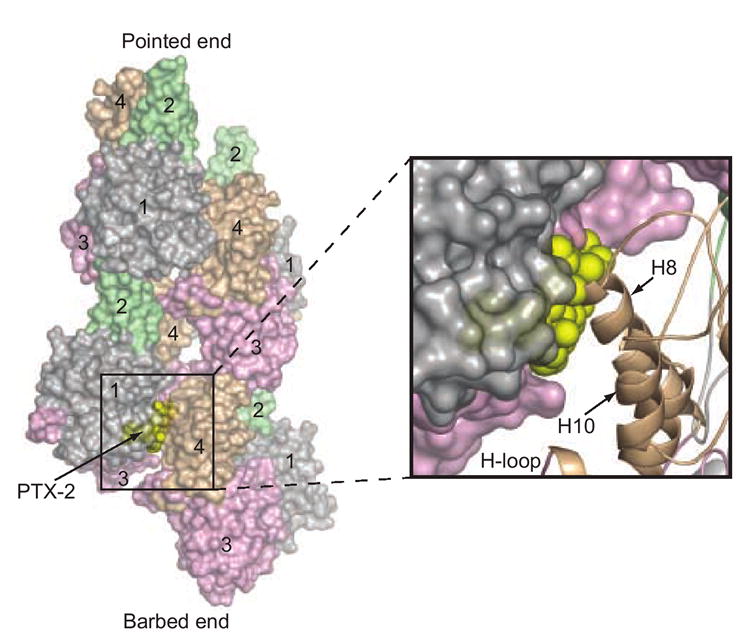
Figure 6. Superposition of PTX-2 onto the F-actin model.

The G-actin-bound conformation of PTX-2 (yellow spheres) is superimposed on the model of F-actin to illustrate the mechanism by which it caps the barbed-end of the filament.37, 40 Four actin subunits are shown (two for each strand) in surface representation. The pointed- and barbed-ends of this “mini-filament” are labeled. Actin subdomains 1–4 are also labeled for each subunit and are colored as in Figure 2. The binding position of PTX-2 is at the interior of the filament. The boxed region shows a magnification of the steric clash between PTX-2 and helix H8 from subdomain 4 of the lower lateral actin subunit (shown in cartoon representation).
