
Figure 7. Surface representation of the interaction of PTX-2 with actin and the location of common differences among PTX variants.
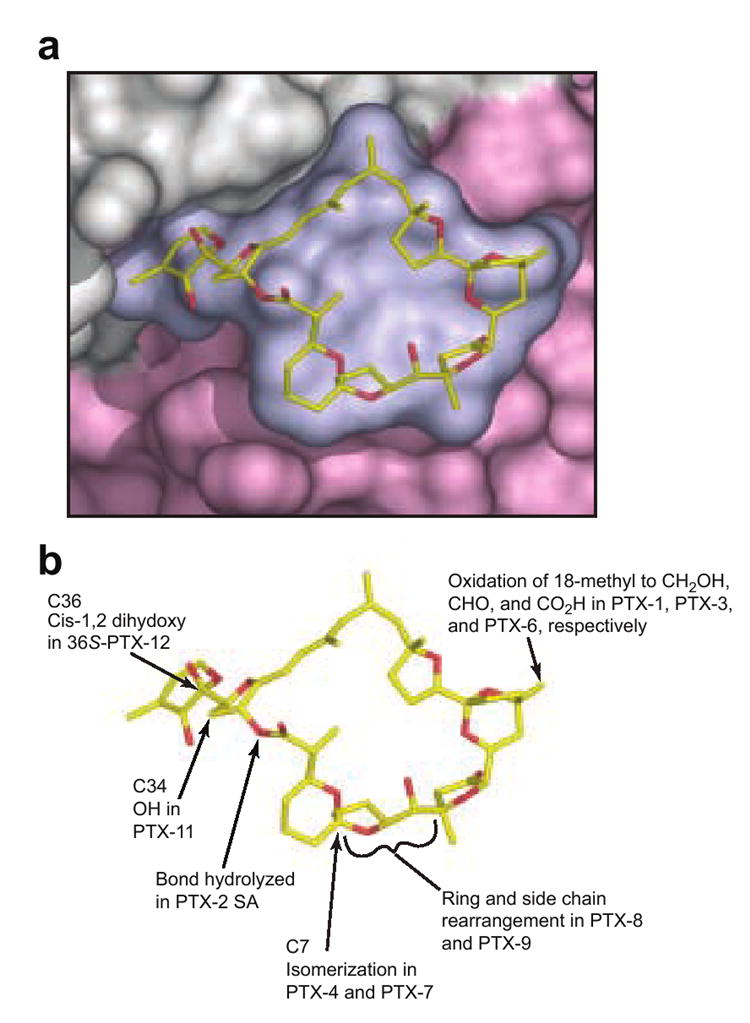
(a) Closeup view of a surface representation of PTX-2 and its binding site on actin where subdomains 1 and 3 are colored in gray and light pink respectively. (b) shows the locations of the chemical differences in common PTX variants. It is immediately clear that the change from (R) configuration at C7 in PTX-2 to the (S) configuration in PTX-4 and -7 can be expected to induce a large change in the shape of the macrolactone ring.