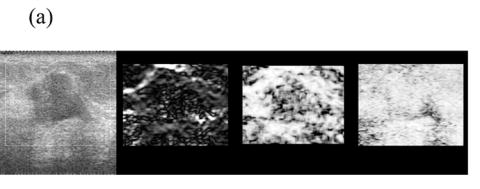
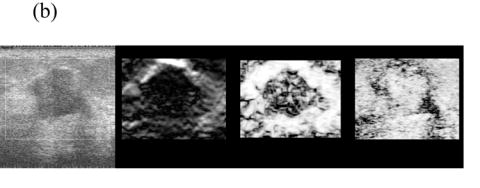
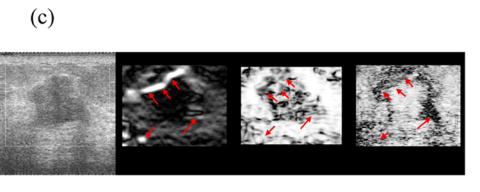
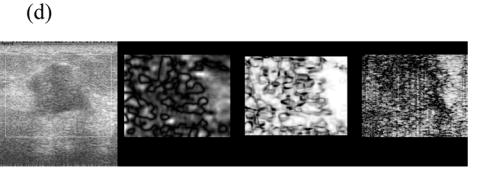
Fig. 5.


Representative (from left to right) B-mode and strain images, local consistency maps and local motion accuracy maps obtained from an in vivo fibroadenoma at (a) 0.4%, (b) 0.9%, (c) 1.5% and (d) 2.5% frame-average strain. All consistency and accuracy maps are linearly scaled between 0.5-1.0 and displayed as 8-bits images.
