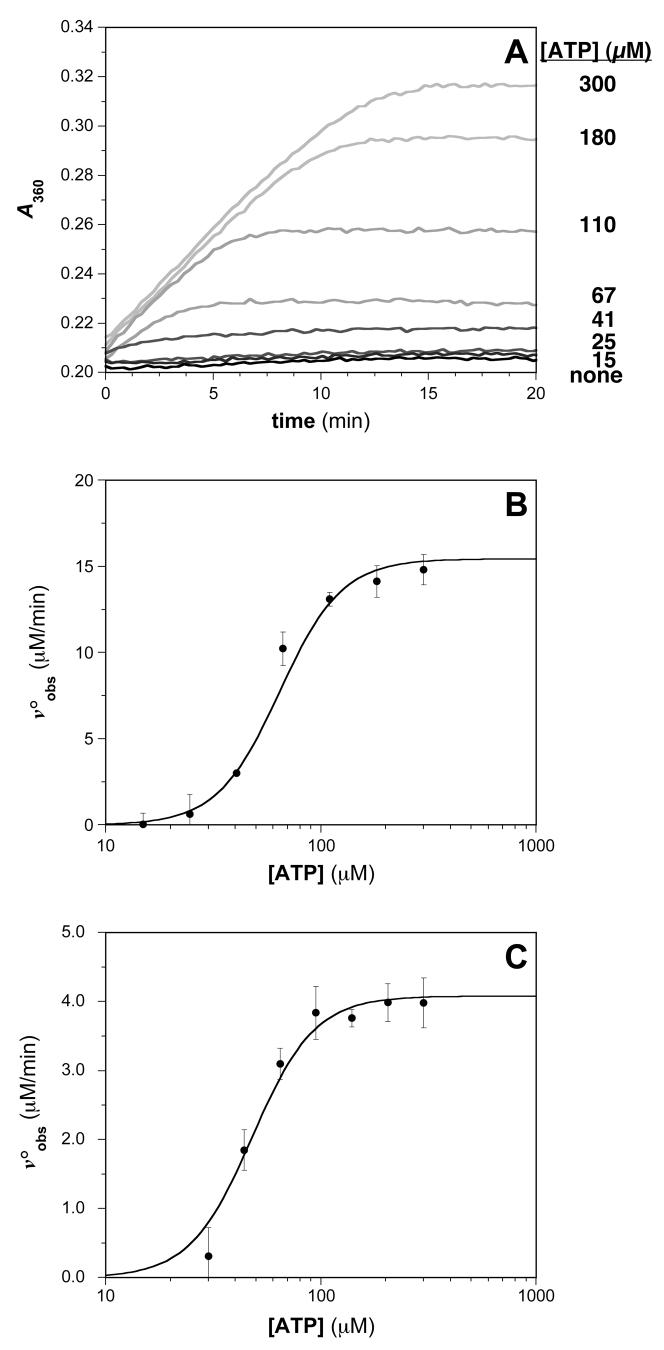
Fig. 5.
Typical results for assays of RecA-DNA ATPase activities. (A) Time-dependent generation of MESG using an enzyme-linked phosphate detection system in the presence of various ATP concentrations. The absorbance at 360 nm for reaction solutions containing 0.5 μM RecA in the presence of the indicated concentration of ATP is monitored. (B) ATP concentration dependence of the steady-state ATP hydrolysis rate. The plot of voobs vs. [ATP] was constructed, where the initial velocities were determined from the slopes of the plots in (A). The steady-state kinetic parameters S0.5 and kcat were obtained using equation 3 as described in Materials and Methods: kcat = 32 ± 2 min-1; S0.5 = 64 ± 2 μM. (C) ATP concentration dependence of the steady-state ATP hydrolysis rate measured using the Biomol Green phosphate detection assay. The S0.5 and Vmax parameters for the reaction were determined using equation 3 as described in Materials and Methods: kcat = 8.2 ± 0.4 min-1; S0.5 = 48 ± 3 μM.

