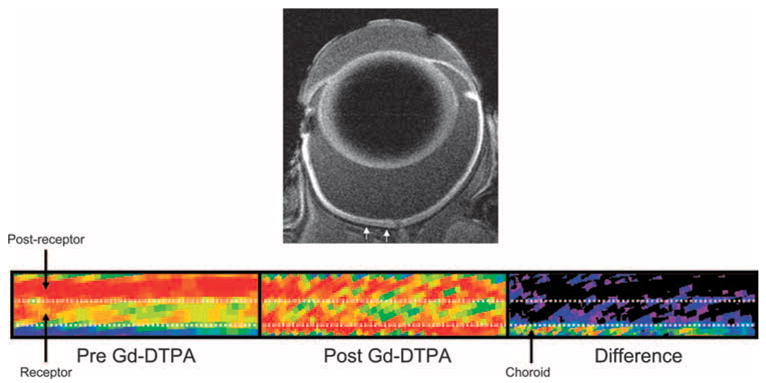
Figure 1.

Top: representative high-resolution MRI image of rat eye 4 hours after intraperitoneal MnCl2 injection. Small white arrows: region in superior retina from which linearized pseudocolor images (bottom) are derived. Bottom: representative regions-of-interest from the same rat before Gd-DTPA (left), after Gd-DTPA (middle), and the difference (right). The same pseudocolor scale was used for all three linearized images, where blue to green to yellow to red represent lowest to highest signal intensity. Uupper dotted white line: boundary between postreceptor and receptor retina of the control retinas demonstrated in previous studies.5,6 Bottom dotted white line: boundary of the posterior aspect of the control retinas. These data suggest a minimal choroidal contribution to intraretinal analysis.
