Figure 4.

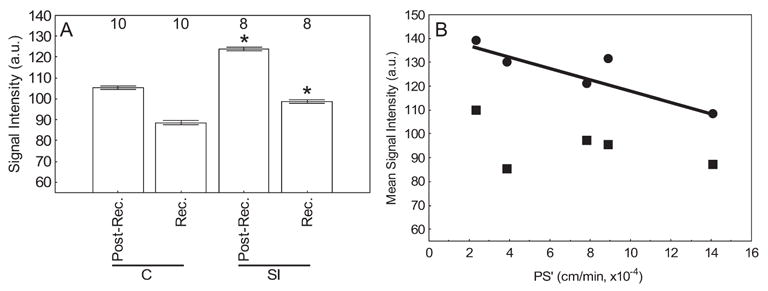
(A) MEMRI signal intensity changes in receptor (rec.) and postreceptor (post-rec.) retina in control (C) and sodium iodate (SI)–treated rats measured 4 hours after intraperitoneal systemic administration of MnCl2 from the regions defined in Figure 1. Open bars: light-adapted groups. Significant differences (*P < 0.05) were noted. Note that the minimum value of the y-axis is set to signal intensity measured in the absence of manganese exposure (i.e., 55).5 Error bars represent SEM, and numbers above the bars give the number of animals studied. (B) Plot of BRB PS′versus MEMRI signal intensity changes in receptor (■) and postreceptor (●) for each rat. A significant negative correlation between BRB PS′ and MEMRI signal was found only for the receptor layer (r2 = 0.78; P < 0.05) and not the postreceptor layer (r2 = 0.25; P > 0.05). The lack of correlation in the postreceptor retina may be attributed to its lower signal-to-noise ratio than in the receptor layer. In any event, after sodium iodate exposure, retinal manganese uptake did not increase with increasing BRB PS′.
