
Figure 5.
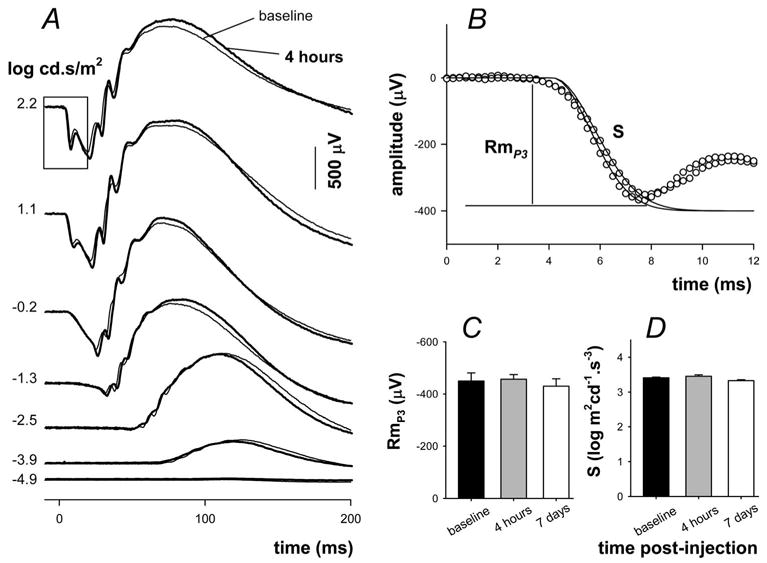
Effect of MnCl2 injection on retinal function. (A) Signals collected 1 week before (thin traces) and 4 hours after (thick traces) drug treatment. Stimulus exposure is given on the left. (B) The leading edge of the photoreceptor response (box, A) is modeled according to a delayed Gaussian model (traces) of phototransduction (P3) to give phototransduction amplitude (RmP3) and sensitivity (S). (C) Average (± SEM; n = 6) RmP3 1 week before (filled), 4 hours after (gray, n = 6), and 7 days after (unfilled, n = 6) intraperitoneal injection of MnCl2. (D) Average (± SEM) phototransduction sensitivity for the same time periods.