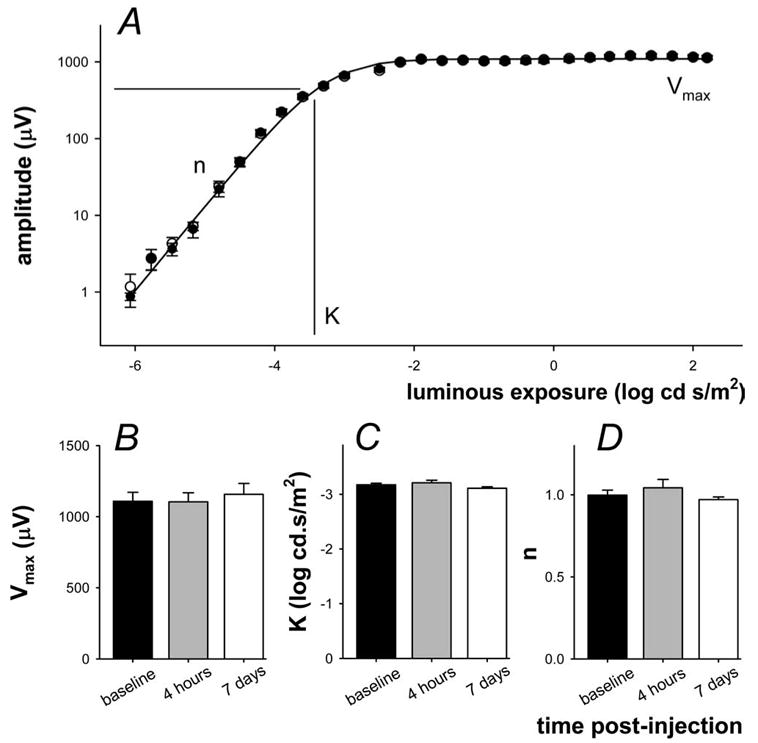
Figure 6.

Effect of MnCl2 injection on the postreceptor (P2) intensity response function. (A) The amplitude of the inner retinal P2 (raw – P3) was assessed by extracting the amplitude at a fixed criterion time of 110 ms. Average (± SEM) data are shown for signals collected at baseline (unfilled, n = 6) and 4 hours after injection (filled). Intensity response functions are described using a Naka-Rushton function to give saturated amplitude (Vmax), semisaturation (K), and slope (n). (B) Average (± SEM) Vmax 1 week before (filled) and 4 hours (gray) and 7 days (unfilled) after IP injection of MnCl2. (C) Average (± SEM) semisaturation. (D) Average (± SEM) slope.
