Figure 7.

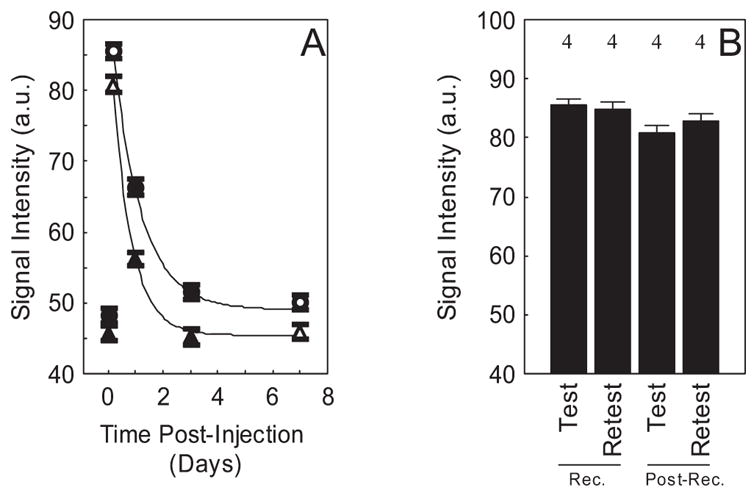
(A) Time course of mean manganese enhancement and clearance in receptor (●) and postreceptor (▲) retina before (time = 0) and after a single IP MnCl2 injection in dark-adapted rats. Solid lines: best-fit curves to the data using a three-parameter exponential decay model. Open symbols: average data from the same group of rats (n = 4). Mean data from two other groups of rats are also presented: baseline (n = 4) and days 1 and 3 (n = 3) after manganese injection. (B) Reproducibility of receptor (Rec.) and postreceptor (Post-Rec.) manganese enhancement in same group of rats indicated by the open symbols in (A) but given a second MnCl2 injection 2 weeks after the first injection (retest). Error bars represent SEM, and numbers above the bars give the number of animals studied.
