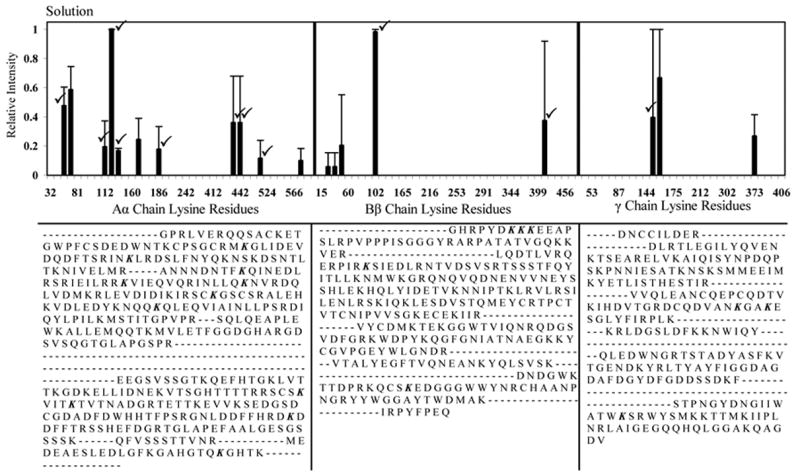
Fig. 7.

Normalized MALDI-TOF spectral peaks corresponding to biotinylated lysine residues within bFg Aα, Bβ, and γ chains, labeled while in a 0.5 mg/mL solution. A cumulative sum of the intensities of all the labeled peptides that contained the listed lysine residues was determined, normalized relative to the highest intensity obtained, and averaged across three separate experiments. Error bars represent one standard deviation. (✓) mark peaks that were also found to be labeled by the more accurate LC-ESI-MS/MS sequence analysis. The MALDI-TOF sequence coverages for each chain are displayed below each graph. Labeled lysine locations are in italics.
