
Fig. 15.
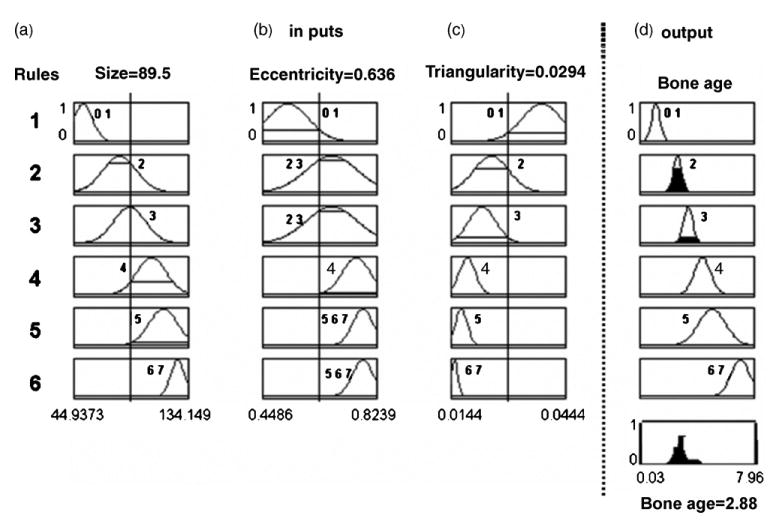
An example of using fuzzy classification for CAD bone age assessment of a given Caucasian male based on membership functions depicted in Fig. 14. Membership functions for each of the three input features (size, eccentricity, and triangularity; columns a, b, and c), and one output which is the chronological age (column d), are reoriented vertically forming six rules (1, 2, …, 6) based on Fig. 14. Three extracted features from the hand image are: size: 89.5, eccentricity: .636, and triangularity: .0294, represented by three vertical lines at each of the three columns, respectively. The output is the aggregation of the solid areas under each rule, which yields a crisp CAD bone age as 2.88-year-old shown in the bottom graph in column (d).