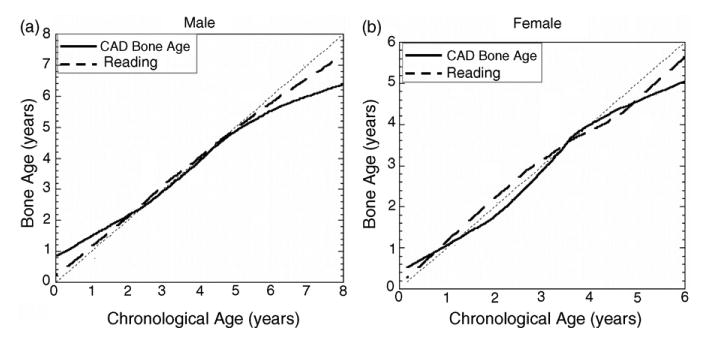
Fig. 18.

Results from the test for two genders with four races combined. In each plot, the solid line represents the CAD results and dashed line represents the average reading of two radiologists. See Section 4 for discrepancies.

Results from the test for two genders with four races combined. In each plot, the solid line represents the CAD results and dashed line represents the average reading of two radiologists. See Section 4 for discrepancies.