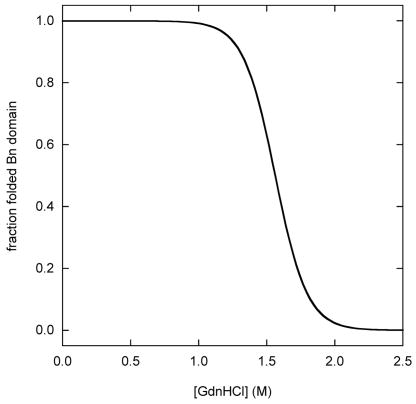
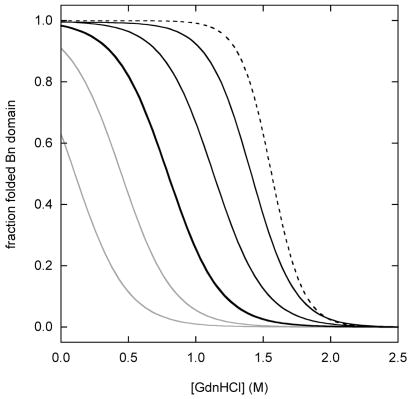
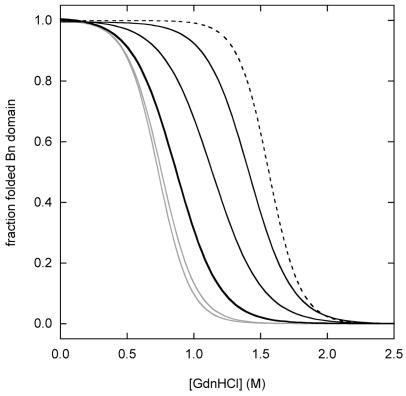
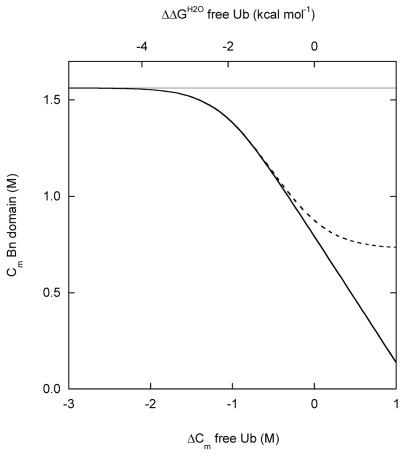
Figure 2.
Simulated Bn domain unfolding curves for three representative coupling regimes: (A) zero coupling (ΔGX = 0), (B) strong coupling (ΔGX = 20 kcal·mol−1), (C) intermediate coupling (ΔGX = 4 kcal·mol−1). WT BU is depicted by the heavy black line. Variants in which the Ub domain is stabilized are shown in gray. Gray curves to the immediate left and far left of WT are mutants stabilized by 1 kcal·mol−1 and 2 kcal·mol−1, respectively. Variants in which the Ub domain is destabilized are shown in black. Black curves to the immediate right and far right of WT are mutants destabilized by 1 kcal·mol−1 and 2 kcal·mol−1, respectively. Free Bn is indicated by the dashed line. Curves are generated from the model in Figure 2 using the following parameters: ΔGB = 7.5 kcal·mol−1, mB = 4.8 kcal·mol−1·M−1, ΔGU = 5.2 kcal·mol−1 (WT), mB = 1.8 kcal·mol−1·M−1. Panel D shows the dependence Bn domain stability on Ub domain stability, as gauged by Cm values. The zero, strong, and intermediate coupling cases are represented by gray, solid black, and dashed black lines, respectively. Bn domain Cm values are derived from fitting the data in panels A–C to the two-state linear extrapolation equation. ΔCm and ΔΔGH2O values on the x-axes are relative to WT Ub.


