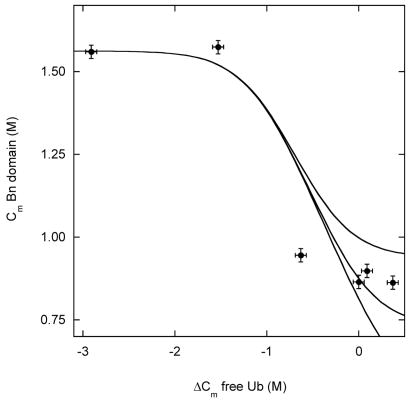
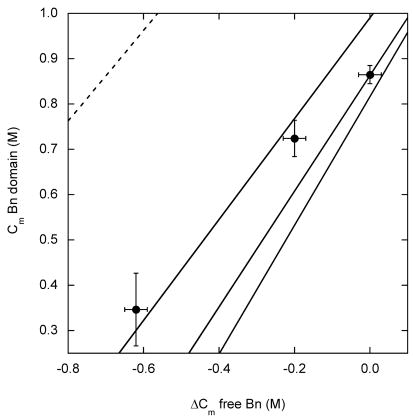
Figure 4.
(A) Stability of the Bn domain of BU, reported by Cm values, as a function of the change in stability of free Ub, determined by ΔCm values. ΔCm is relative to free WT Ub. Circles represent the following variants, from left to right: V26G, V26A, K29N, K29Q, WT, R42E. Lines are simulated results using ΔGX values of 3 kcal·mol−1, 4 kcal·mol−1 and 5 kcal·mol−1(from upper to lower curves); see text for other parameters. (B) Stability of the Bn domain of BU as a function of the stability of free Bn. ΔCm is relative to free WT Bn. Data points are, from left to right: I96A, I96V, WT. Solid lines are simulated results for ΔGX values of 3 kcal·mol−1, 4 kcal·mol−1 and 5 kcal·mol−1 (from left to right). Dashed line is the simulated result for ΔGX = 0.


