
Figure 5.
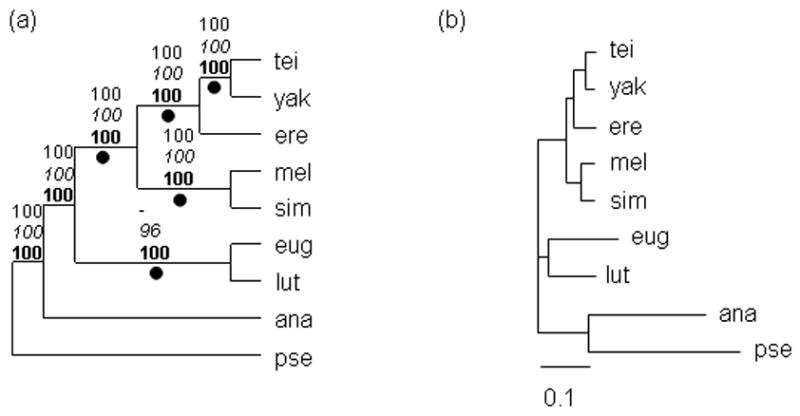
(a) Consensus tree for multi-locus analysis. Branch labels are the same as Figure 4. (b) Phylogram for the multi-locus analysis. The scale bar represents 0.1 expected substitutions per site.
Official websites use .gov
A
.gov website belongs to an official
government organization in the United States.
Secure .gov websites use HTTPS
A lock (
) or https:// means you've safely
connected to the .gov website. Share sensitive
information only on official, secure websites.
(a) Consensus tree for multi-locus analysis. Branch labels are the same as Figure 4. (b) Phylogram for the multi-locus analysis. The scale bar represents 0.1 expected substitutions per site.