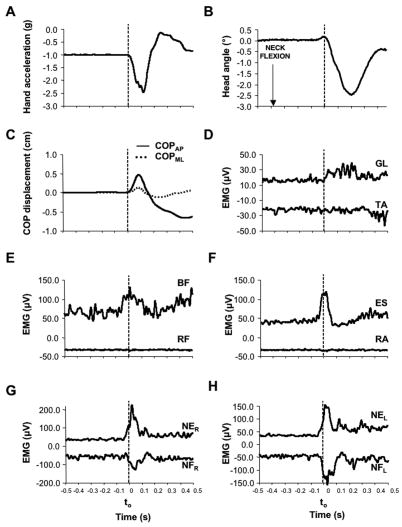
Figure 2.
A typical data set from a representative subject (subject #1) during downward arm movement in a TP trial. Hand acceleration (Panel A), Head angular displacement (Panel B), displacement of COP in both directions (Panel C), and EMGs of all ten muscles recorded (Panels D through H) are displayed. Time zero (t0) corresponds to the initiation of hand action. Note: TA, RF, RA, NFR, and NFL EMG time profiles were inverted (turned into negative values) to avoid superposition of lines; for these muscles negative values of larger magnitude indicate increased muscle activation.

