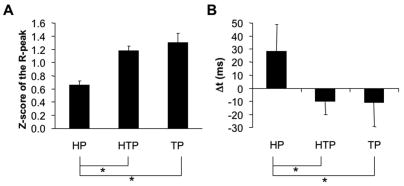
Figure 7.
Results of the cross-correlation analysis between neck flexor and extensor EMGs. Panel A shows averaged across subjects z-scores with standard error bars of the peak correlation coefficient (R-peak). Panel B shows the average time lag (Δt) at R-peak under the head, trunk, and head and trunk perturbations (HP, TP, and HTP, respectively). Positive values in panel B indicate an earlier EMG burst in the neck extensor as compared to the neck flexor. * means p<0.05. Lines connecting the mean bars indicate the differences found.

