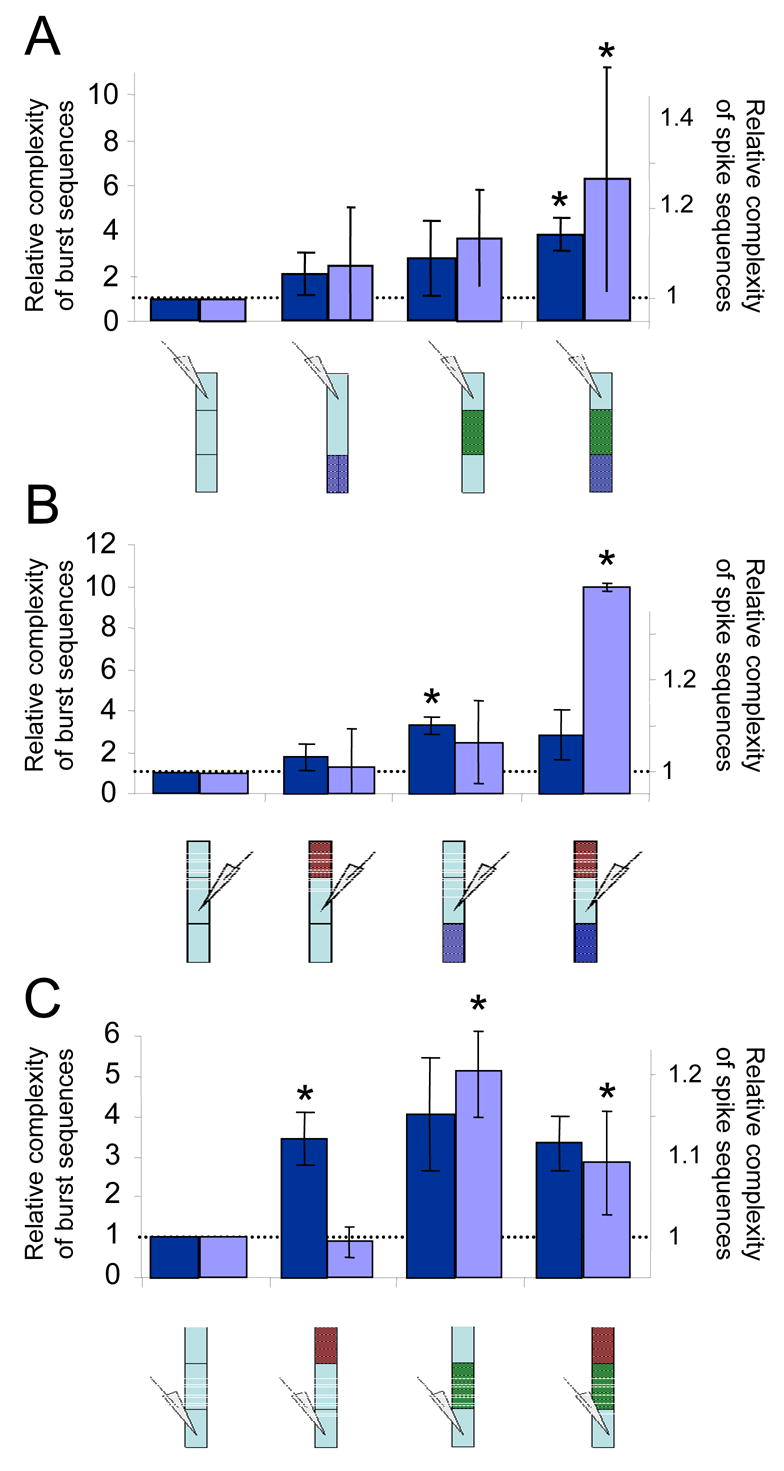
Figure 7.

Structural complexity (see details in Method section) computed for the sequences of spike or burst times recorded in the different experimental conditions reveals a similar trend of increase in non-random variability with elimination of inputs. A, B, C show results of analyses conducted on all recordings obtained from the rostral, middle or caudal regions of spinal segments respectively. Data shown as change from control; statistical significance is indicated. Analysis of spike or burst sequences are shown in dark and light bars respectively.
