
Figure 6-1.
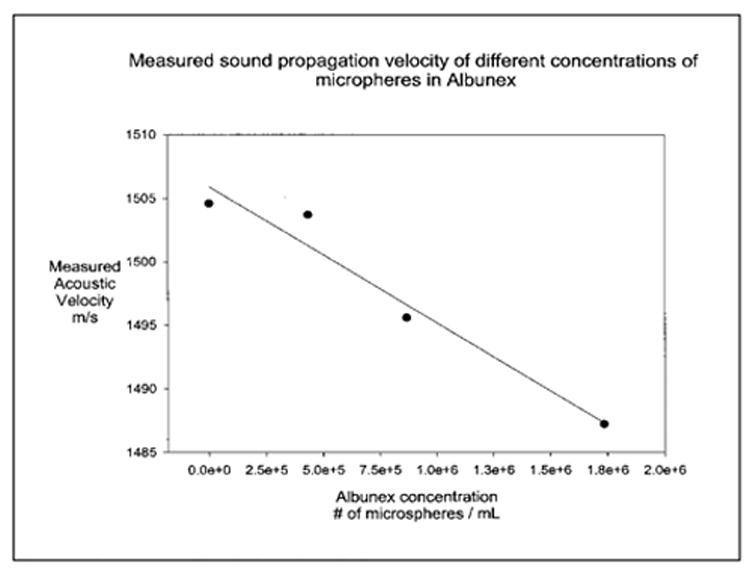
Sound velocity in an Albunex suspension as a function of concentration. The solid circles and the line represent the data points and the least squares regressions line, respectively.
Official websites use .gov
A
.gov website belongs to an official
government organization in the United States.
Secure .gov websites use HTTPS
A lock (
) or https:// means you've safely
connected to the .gov website. Share sensitive
information only on official, secure websites.
Sound velocity in an Albunex suspension as a function of concentration. The solid circles and the line represent the data points and the least squares regressions line, respectively.