Figure 6-6.

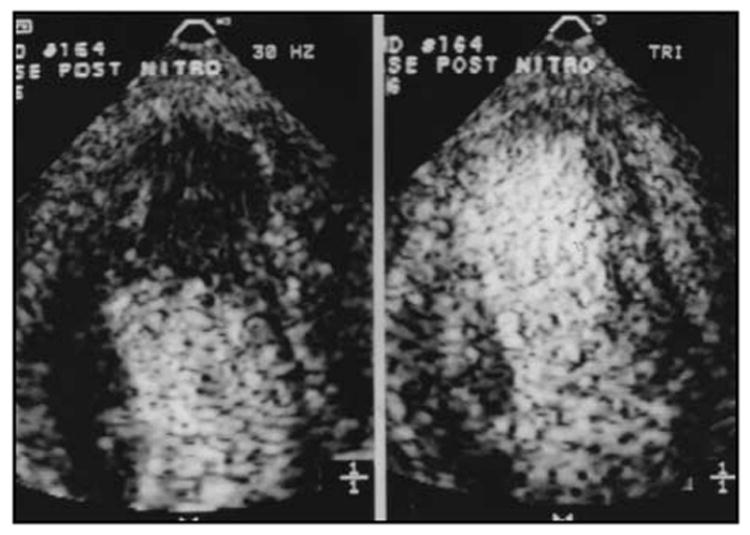
An example of the increase in myocardial contrast observed during continuous infusion of PESDA microbubbles when using a low frame rate (right panel) as opposed to conventional frame rates (left panel); the latter are usually > 30 Hz.

An example of the increase in myocardial contrast observed during continuous infusion of PESDA microbubbles when using a low frame rate (right panel) as opposed to conventional frame rates (left panel); the latter are usually > 30 Hz.