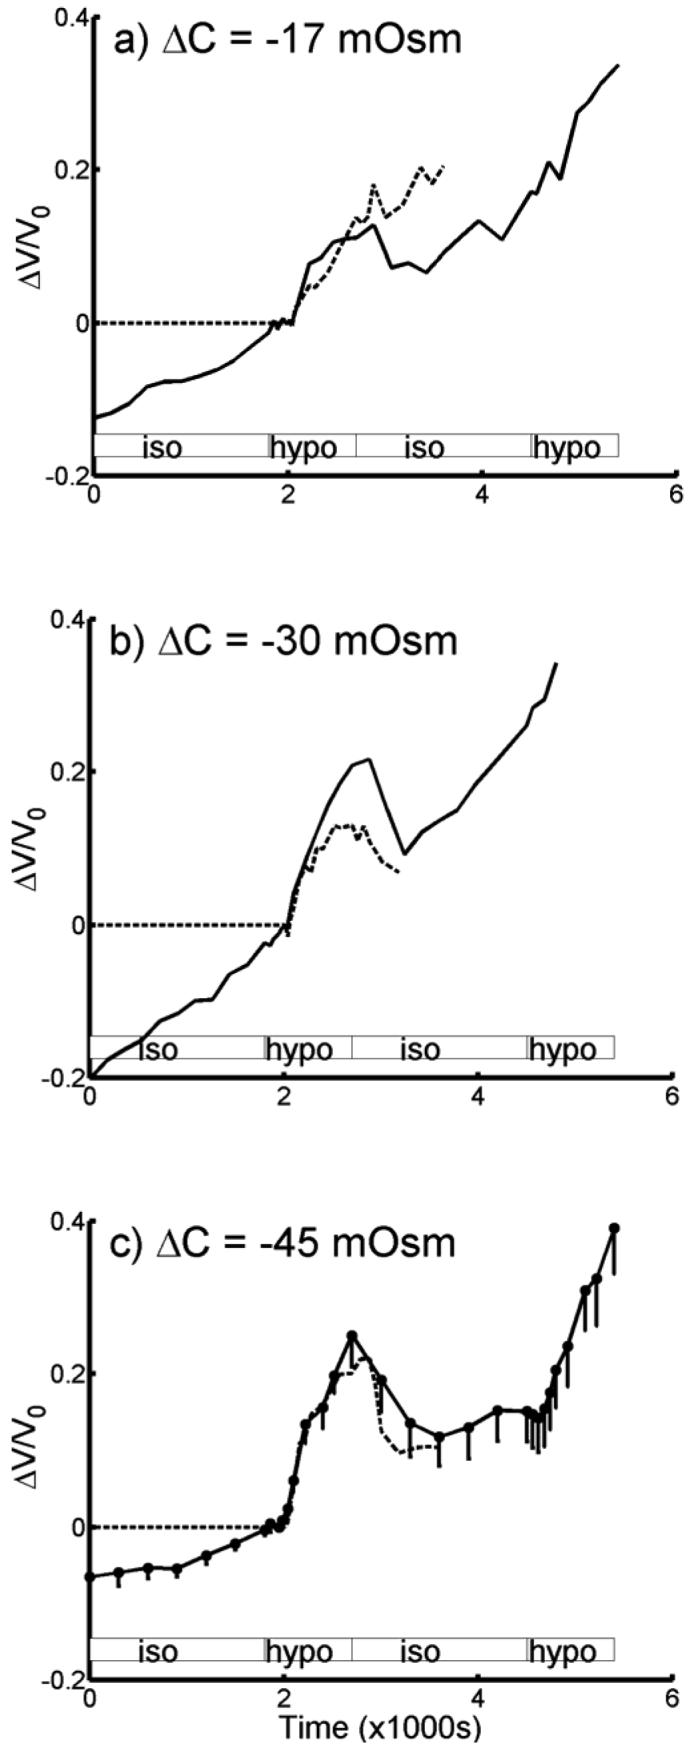
Fig. 1.

Relative volume change averaged from salicylate-treated OHCs (—) and compared with untreated OHCs (- - -). Volume change has been normalized with respect to volume at start of hypotonic perfusion at 2010 s. a) ΔC = −17 mOsm (treated, n = 10; untreated, n = 9), b) ΔC = −30 mOsm (treated, n = 8; untreated, n = 10) and c) ΔC = −45 mOsm, (treated, n = 13; untreated, n = 15). For clarity, half-error bars in s.e.m. are only shown in (c). The change in volume response for untreated cells prior to hypotonic perfusion is negligibly small and assumed to be zero (ref. 4; see also ketoglutarate treated cells in fig. 3). Shaded boxes indicate duration of perfusion of the different solutions (isotonic and hypotonic solutions); note the dead time of approximately 210s.
