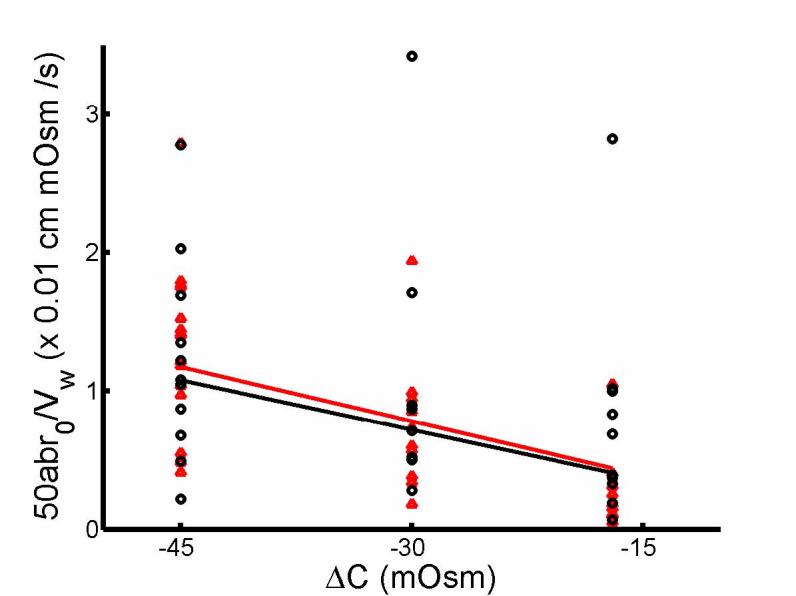
Fig. 2.

Linear relationship between initial rate of change in OHC volume, 50abr0/Vw, and magnitude of osmotic challenge, ΔC. ab and r0 are obtained from exponential fitting of OHC volume change in response to hypotonic solution and the initial radius respectively for salicylate-treated (black) and untreated (red) cells. Linear regression of the two straight lines yielded Pf = 2.6 × 10⁻⁴ cm/s (R2 = 0.814) and Pf = 2.4 × 10⁻⁴ cm/s (R2 = 0.769) for untreated and treated OHCs respectively.
