Fig. 6.

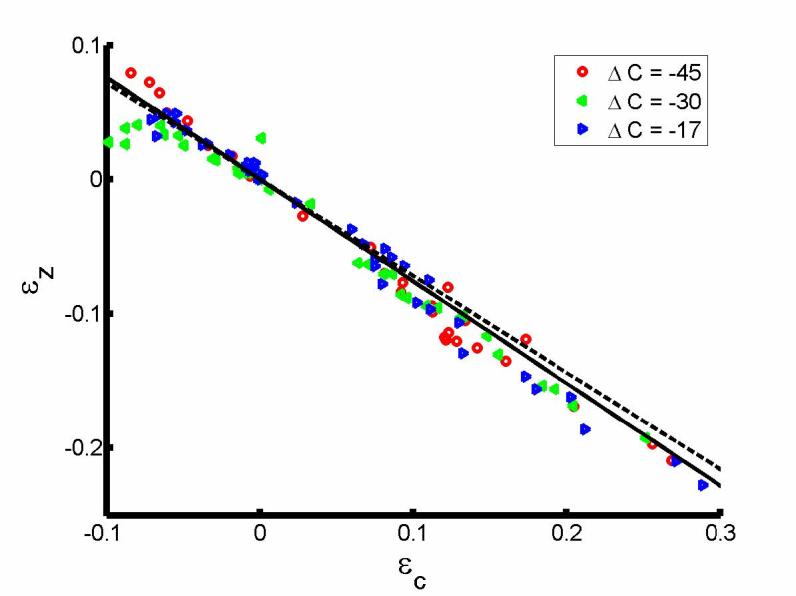
Plot of εz against εz for salicylate-treated OHCs. Linear regression of the solid line (—) through the origin gave a slope of −0.76. Also shown is the dashed line for untreated OHCs with slope of −0.72 (--, Ratnanather et al., (1996a)).

Plot of εz against εz for salicylate-treated OHCs. Linear regression of the solid line (—) through the origin gave a slope of −0.76. Also shown is the dashed line for untreated OHCs with slope of −0.72 (--, Ratnanather et al., (1996a)).