
Figure 1.
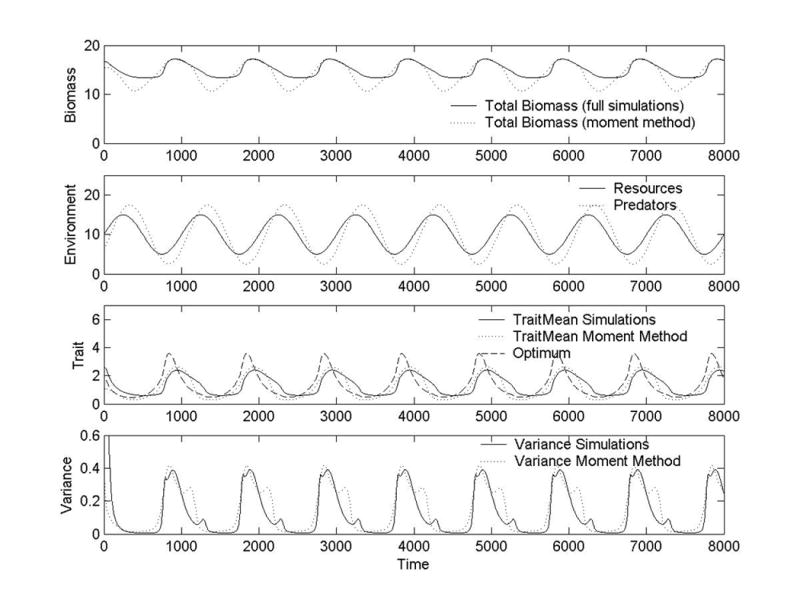
Plots of total biomass, environmental variables (resource abundance and predator population density), mean trait, optimal trait, and trait variance versus time based on simulations of both the exact equations (full simulations) and the moment-closure approximations. This simulation is for a frequency dependent growth function (Eq. (6)) using the parameter values d = 0.05, δ = 0.05, b = 1, μ = 1, h = 100. The environmental variables were chosen to be and . Total immigration per time step is 0.001.