
Figure 3.
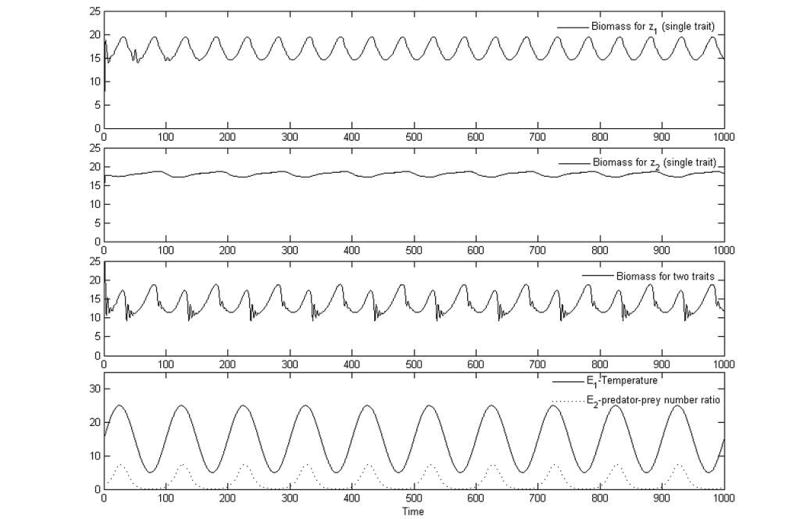
Plots of biomass versus time for growth functions modeling tradeoffs in optimal temperature (panel 1), predator-prey dynamics (panel 2), and the combined effects of predator prey and optimal temperature (panel 3), as well as a plot (panel 4) of the environmental variables (temperature and predator density) versus time. All of these use Eq. (32). For optimal temperature alone, the parameter values are p = 5,σ2 = 2, K = 20, d = 0.1, , r = 0, g = 0, E2 = 0, and z1 = 0. For predator-prey dynamics alone, the parameter values are p = 5, K = 20, r = 0.1, g = 1, d = 0.1, , E1 = 0, and z2 = 0. For combined effects of predator-prey dynamics and optimal temperature tradeoffs, the parameter values are p = 5, σ2 = 2, K = 20, d = 0.1, , r = 0.1, g = 1, and . Total immigration per time step is 0.1 for the single-trait simulations and 1 for the two-trait simulations. More immigration is necessary for the two-trait case because there are many more functional groups (species), and immigration occurs for each one.