
Figure 4.
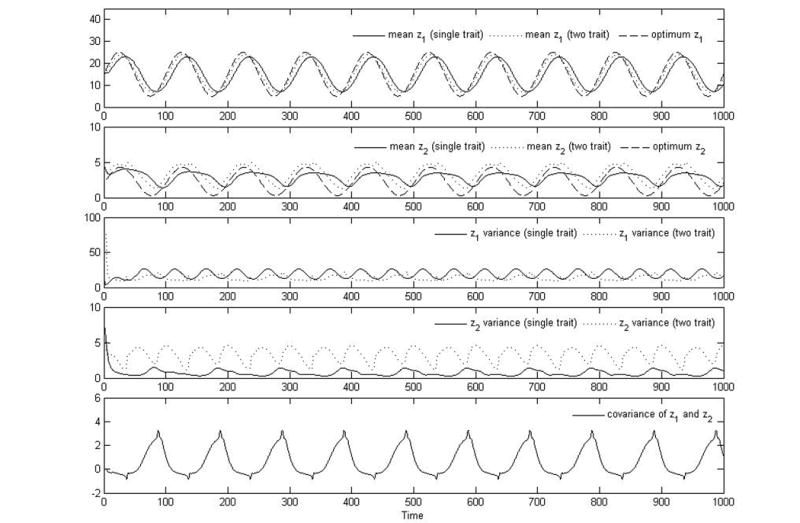
Plots of trait mean for optimal temperature, z1 (panel 1), investment in predator defense, z2 (panel 2), variance in z1 (panel 3) and z2 (panel 4), and covariance between z1 and z2 (panel 5) versus time for growth functions modeling tradeoffs in predator-prey dynamics, optimal temperature, and the combined effects of predator prey and optimal temperature. These are results from the same simulations as in Fig. (3). The simulations all use Eq. (32). For optimal temperature alone, the parameter values are p = 5, σ2 = 2, K = 20, d = 0.1, , r = 0, g = 0, and E2 = 0. For predator-prey dynamics alone, the parameter values are p = 5, K = 20, r = 0.1, g = 1, d = 0.1, , E1 = 0, and z2 = 0. For combined effects of predator-prey dynamics and optimal temperature tradeoffs, the parameter values are p = 5, σ2 = 2, K = 20, d = 0.1, , r = 0.1, g = 1, and . Total immigration per time step is 0.1 for the single trait simulations and 1 for the two-trait simulations. More immigration is necessary for the two-trait case because there are many more functional groups (species), and immigration occurs for each one.