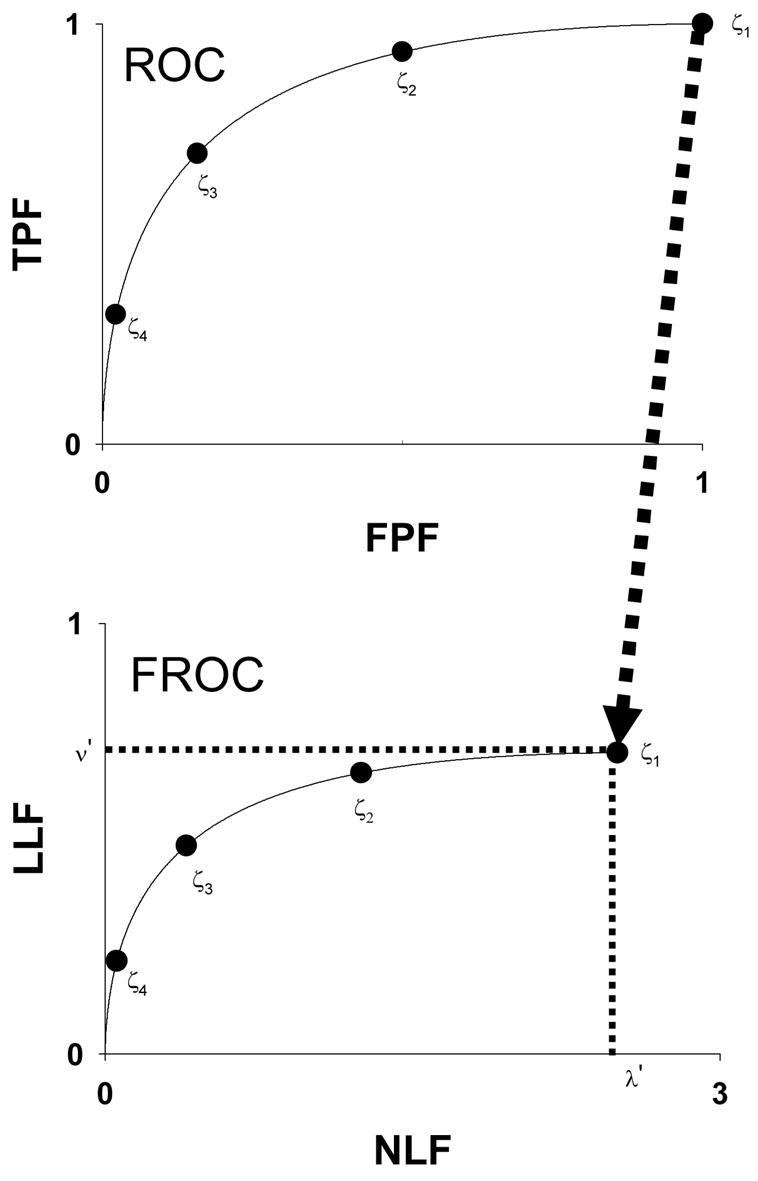
Figure 1.

This figure illustrates the IDCA approach to fitting FROC operating points. IDCA regards the lesion and non-lesion localization counts as arising from normal and abnormal “cases” in a pseudo-ROC study. The counts are analyzed by ROC curve-fitting software yielding the fitted curve shown in the upper panel. The FROC curve, shown in the lower panel, is obtained by a mapping operation indicated by the arrow, consisting of a point-by-point multiplication of the pseudo-ROC curve along the y-axis by ν′, and along the x-axis by λ′, where (λ′,ν′) are the coordinates of the observed end-point of the FROC curve. Therefore the corner (1, 1) maps to the end-point (λ′,ν′) and each pseudo-ROC point maps to a unique FROC point. Four pseudo-ROC and four FROC operating points and the corresponding cutoffs ζi (i = 1, 2, 3, 4) are shown.
