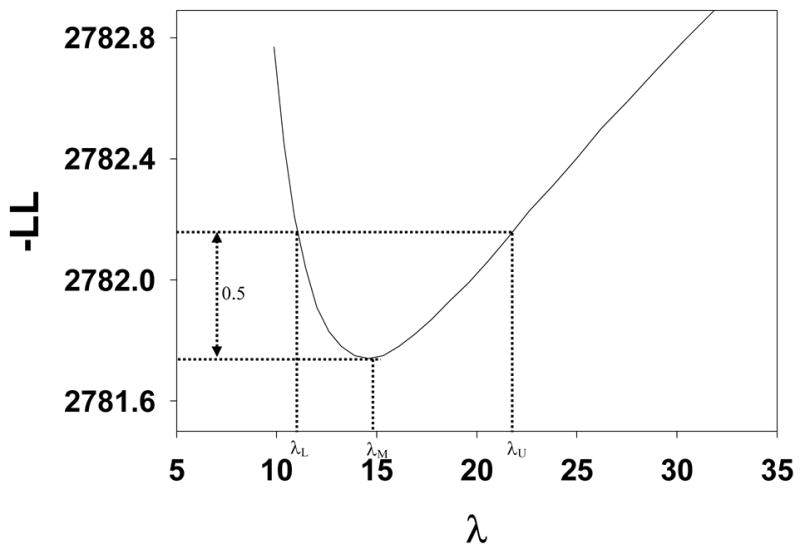
Figure 3.

A typical plot of −LLλ (λ) vs. λ, where the ordinate is the value of the negative of the log likelihood after it has been minimized with respect to all parameters except λ. It is seen that −LLλ (λ) has as a minima at λ = λM and [λL,λU ] illustrates the construction of an asymmetric confidence interval for λ, see text.
