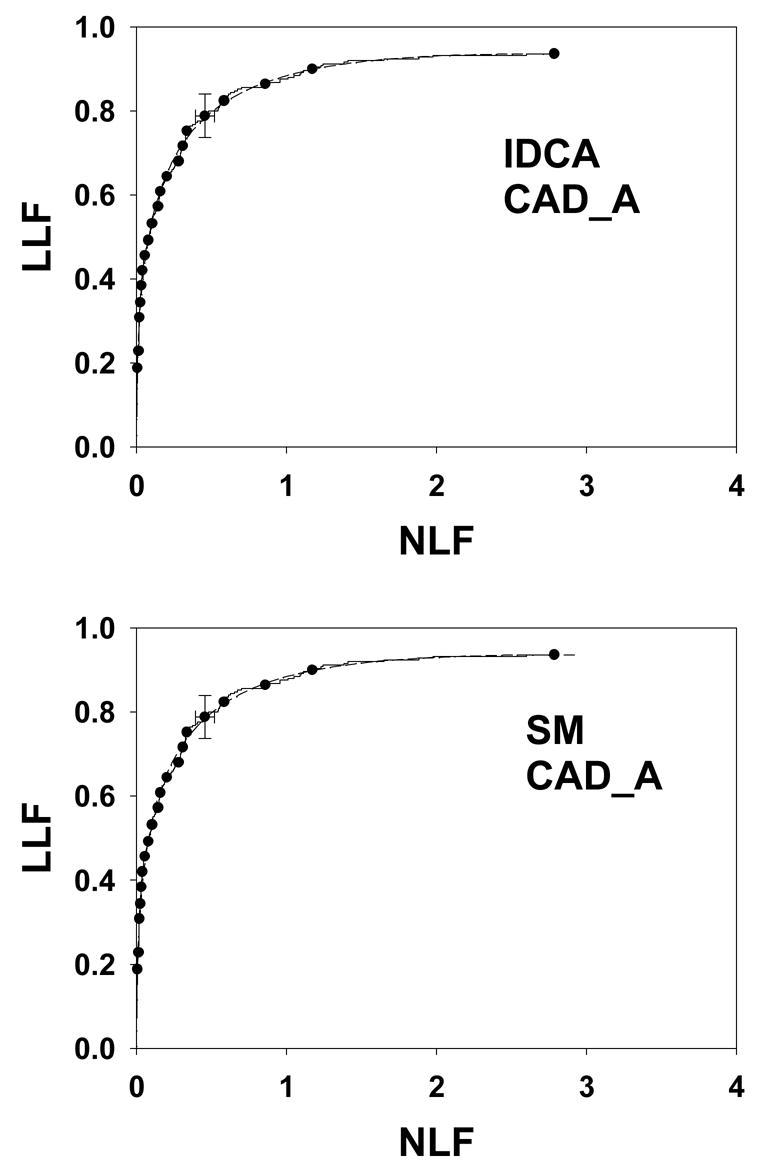
Figure 4.

IDCA (upper panel) and search model (lower panel) fits to data set CAD_A. The dashed curves correspond to the model fits (IDCA – upper panel, or search model – lower panel) and the solid curves are the raw data (the same raw data is plotted in the upper and lower panels). Since the fits are close to the raw data it is difficult to distinguish between them – the “staircase” pattern corresponding to the raw data may be helpful. The solid circles are operating points resulting from binning the data, and the binned data was used by the fitting procedures. They are constrained to lie exactly on the raw curve. Shown are 95% confidence intervals for an intermediate operating point. Both fits are visually excellent although the statistical measures of quality of fit are not as good (p-values 0.0074 and 0.0073, see text for more discussion of this aspect).
